


 本文详细介绍如何在Vue项目中引入并使用Echarts绘制折线图,并提供了完整的代码实例,包括配置项说明及样式设置。
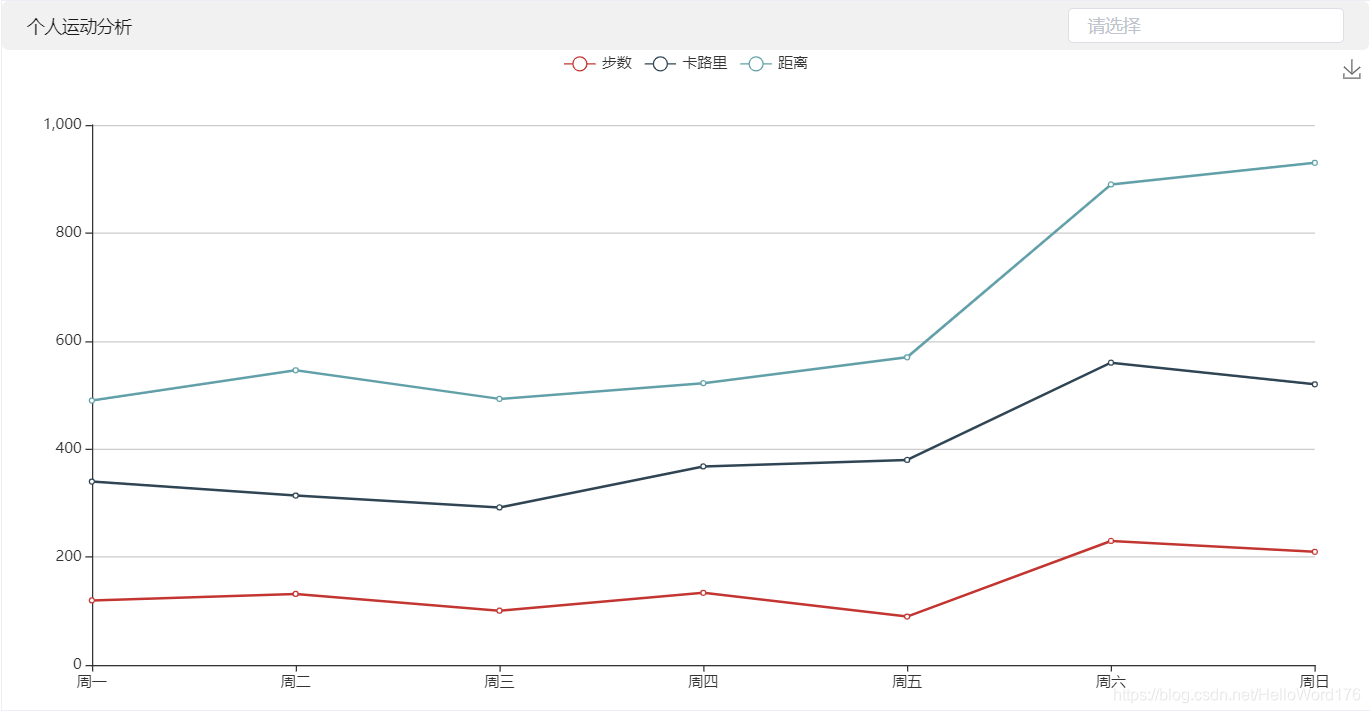
先看效果:
1. 安装Echats
npm install echarts --save2. 项目入口文件main.js中引入Echarts
// 引入echarts
import echarts from 'echarts';
Vue.prototype.$echarts = echarts;
例子:
<template>
  <div id="personDetail" ref="personDetail"></div>
</template>
<script>
export default {
  mounted(){

    let myChart = this.$echarts.init(this.$refs.personDetail);
    let option = {
      title: {
        // text: "折线图堆叠",
      },
      tooltip: {
        trigger: "axis",
      },
      legend: {
        data: ["步数", "卡路里", "距离"],
      },
      grid: {
        left: "3%",
        right: "4%",
        bottom: "3%",
        containLabel: true,
      },
      toolbox: {
        feature: {
          saveAsImage: {},
        },
      },
      xAxis: {
        type: "category",
        boundaryGap: false,
        data: ["周一", "周二", "周三", "周四", "周五", "周六", "周日"],
      },
      yAxis: {
        type: "value",
      },
      series: [
        {
          name: "步数",
          type: "line",
          stack: "总量",
          data: [120, 132, 101, 134, 90, 230, 210],
        },
        {
          name: "卡路里",
          type: "line",
          stack: "总量",
          data: [220, 182, 191, 234, 290, 330, 310],
        },
        {
          name: "距离",
          type: "line",
          stack: "总量",
          data: [150, 232, 201, 154, 190, 330, 410],
        }
      ],
    };
    // 使用刚指定的配置项和数据显示图表。
    myChart.setOption(option);
  },
};
</script>
<style scoped>
#personDetail {
  height: 528px;
}
</style>
Echarts折线图属性设置大全:


 273
273


 到【灌水乐园】发言


