


 本文介绍了如何在ARM和X86架构的openEuler环境中部署和配置Prometheus、Pushgateway、Grafana及opengauss_exporter,重点讲解了如何通过benchmarksql的tpmC值监控和数据发送。包括日志采集、TPMC计数、pushgateway使用、opengauss_exporter配置以及Prometheus和Grafana的可视化设置。
1、前期准备
1.1项目依赖链接
| 依赖开源工程 | 工程链接 |
|---|---|
| 普罗米修斯 | https://github.com/prometheus/pushgateway |
| opengauss_export | https://github.com/enmotech/opengauss_exporter |
| pushgateway | https://github.com/prometheus/pushgateway |
| openGauss | https://gitee.com/opengauss/openGauss-server |
1.2 工具包准备
| 系统环境 | 工具版本 |
|---|---|
| ARM+openEuler | prometheus-2.21.0.linux-arm64.tar.gz、pushgateway-1.2.0.linux-arm64.tar.gz、grafana-7.1.5-1.aarch64.rpm |
| X86+openEuler | prometheus-2.21.0.linux-amd64.tar.gz、pushgateway-1.3.0.linux-amd64.tar.gz、grafana-7.2.1-1.x86_64.rpm |
2、监控系统安装部署
2.1 tpmC采集和发送
'''
功能描述:在benchmarksql工具测试过程的输出信息通过tee命令 固定输出到/tmp/tpcc.log(便于在不同环境上部署),采集函数从/tmp/tpcc.log文件获取到tpmC值,发送函数将值发送到pushgateway服务。
'''
#日志信息采集并转换为tpmC
def collect_tpmc():
    log_file = "/tmp/tpcc.log"
    cmd = "tail -1 %s > /home/tpmc;awk -F ':' '{print $(NF-2)}' /home/tpmc | awk '{print $1}'" % log_file
    tpmc = os.popen(cmd).read().strip()
    tpmc = float(tpmc) * 0.45
    count_tpmc = "count_tpmc{count_tpmc=\"count_tpmc\"} " + str(tpmc) + "\n"
    print("count_tpmc : %s" %count_tpmc)
    return count_tpmc
#向pushgateway发送采集到的数据
def send_data(data_type, node):
    if data_type == "cpu":
        send_cmd = "cat {file_cpu} | curl --data-binary @- pushgateway_ip:port/metrics/job/{node}/instance/{data_type}".format(
            file_cpu=file_cpu, node=node, data_type=data_type)
    os.popen(send_cmd)
2.2 pushgateway的使用
cd pushgateway-1.2.0.linux-arm64
./pushgateway
网页显示效果如下:

2.3 opengauss_exporter的使用
GO GET配置
git config --global http.proxy http://域账号:密码
git config --global https.proxy https://域账号:密码
git config --global http.sslverify false
git config --global https.sslverify false
GO MODULE配置
export GO111MODULE=on
export GOPROXY=http://***/
export GONOSUMDB=*

配置数据库白名单
host    all             all             ip      md5

配置启动opengauss_exporter
cd opengauss_exporter-master
make build
export DATA_SOURCE_NAME="postgresql://tpcc:******@ip:port/tpcc?sslmode=disable"
./bin/opengauss_exporter --config="og_exporter_default.yaml"
注:默认端口为9187
启动效果

2.4 prometheus的使用
prometheus.yml 文件配置参考
scrape_configs:
  # The job name is added as a label `job=<job_name>` to any timeseries scraped from this config.
  - job_name: 'prometheus'

    # metrics_path defaults to '/metrics'
    # scheme defaults to 'http'.

    static_configs:
    - targets: ['prometheus_ip:9090']

  - job_name: 'pushgateway'
    static_configs:
    - targets: ['pushgateway_ip:9091']
      labels:
        instance: pushgateway

  - job_name: 'opgs_report'
    static_configs:
    - targets: ['opgs_report:9187']
      labels:
        instance: opgs_report

 #启动方式
 ./prometheus
启动效果

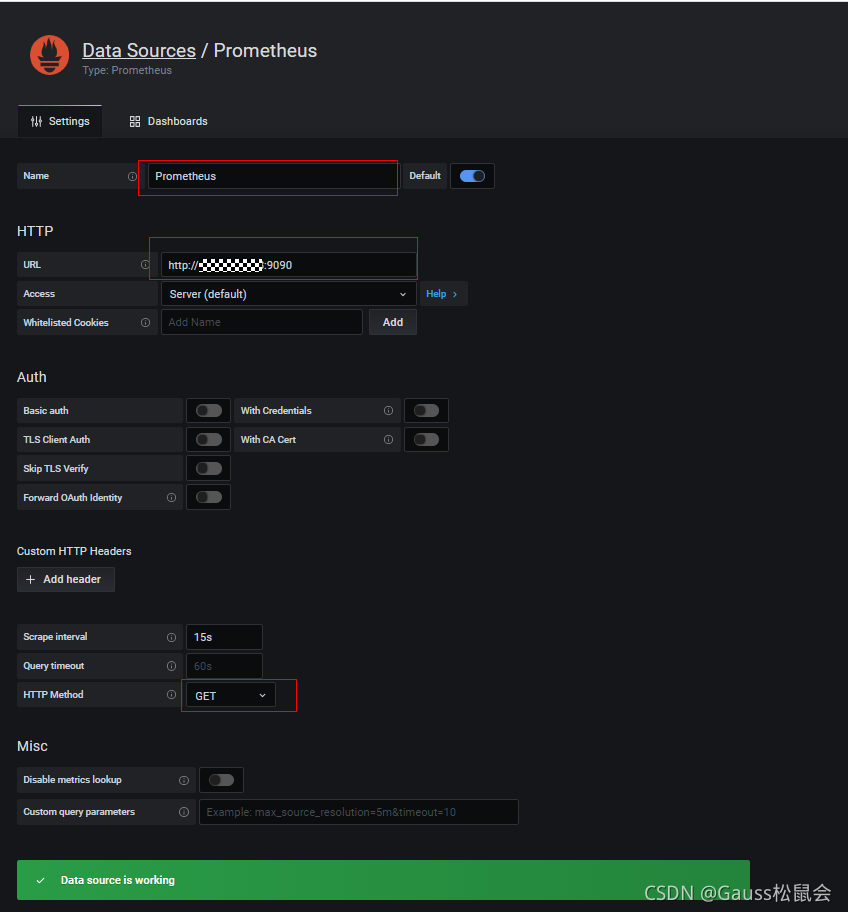
2.5 grafana的使用
yum install grafana-7.1.5-1.aarch64.rpm
service grafana-server start

网访问prometheus_ip:3000
初始用户名密码均为admin
数据源的配置
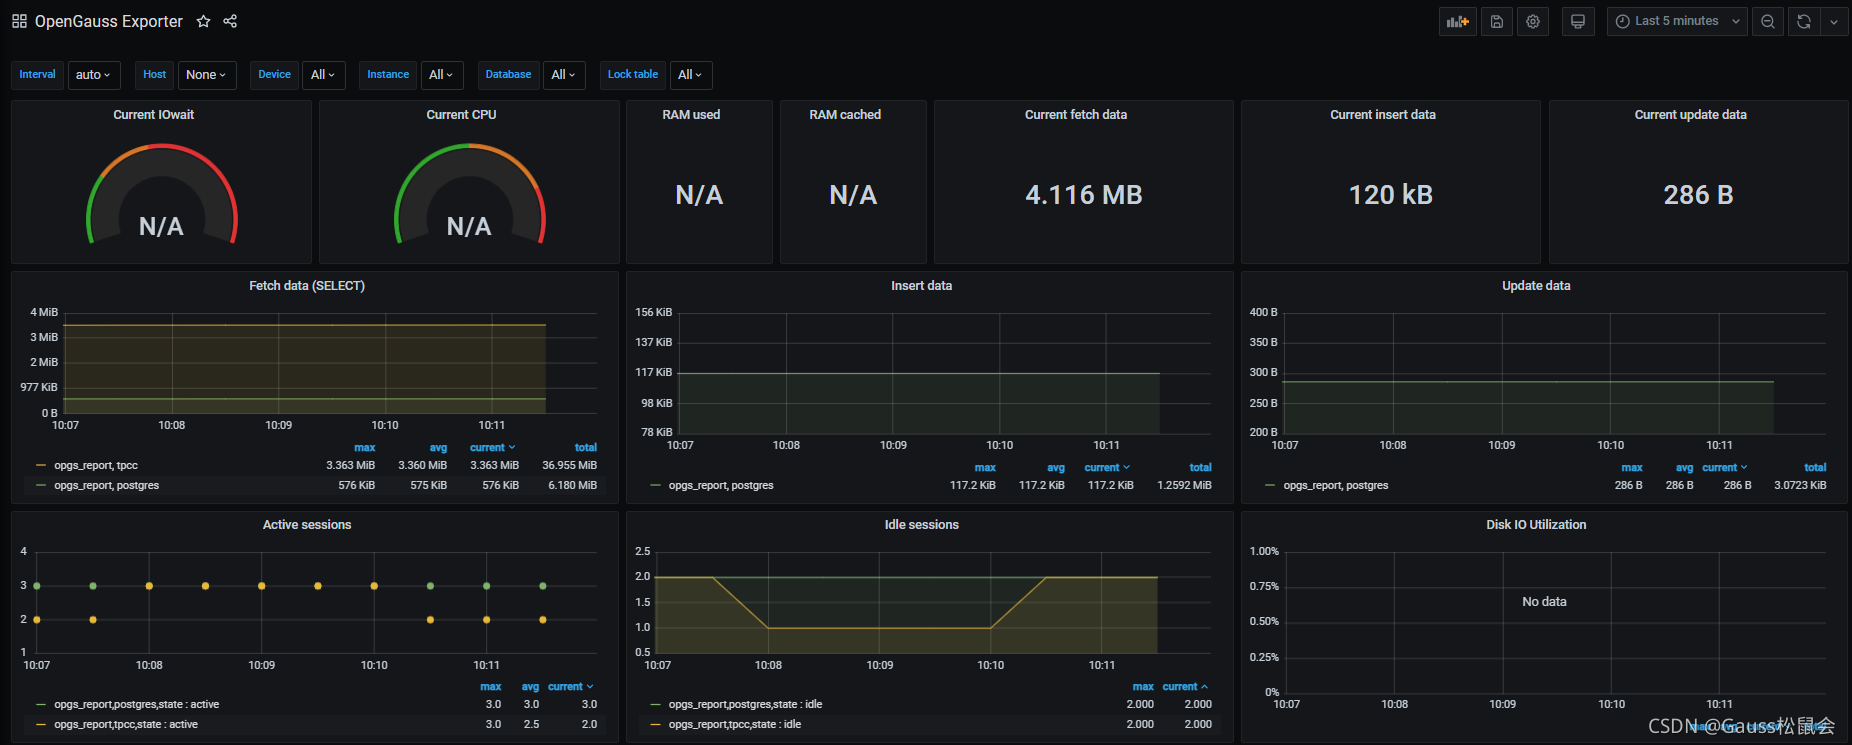
Dashboard的导入
openGauss_exporter工程 界面模板路径如下
opengauss_exporter-master\opengauss_exporter-master\dashboard\
模板也可根据自己需求灵活配置
界面效果如下
tpmC显示panel的添加


 7万+
7万+

 被折叠的 条评论
为什么被折叠?
被折叠的 条评论
为什么被折叠?
 到【灌水乐园】发言


