


 本文介绍了Tensorflow中的一些高级操作,包括使用tf.where取出元素为True的坐标,结合tf.gather_nd进行操作;利用tf.scatter_nd在全0张量上按索引更新值;通过meshgrid创建多维坐标网格;并展示了如何用Tensorflow绘制等高线图。此外,还展示了tf.where根据条件选择Tensor元素以及绘制3D等高线图的方法。
Tensorflow(十三) —— Tensor的进阶操作方法
1. 主要方法
1、where 取出元素为True的坐标
2、scatter_nd
3、meshgrid
2. tf.where(tensor)
# ************** tf.where(tensor)
"""
可结合gather_nd操作
"""
a = tf.random.normal([3,3])
mask = a > 0
print("a:",a.numpy())
print("mask:",mask.numpy())

c = tf.boolean_mask(a,mask)
print("c:",c.numpy())

indices = tf.where(mask)
print("indices",indices.numpy())

d = tf.gather_nd(a,indices)
print("d:",d.numpy())
3. tf.where(condition,A,B)
a = tf.random.normal([3,3])
mask = a < 0
print("mask:",mask.numpy())

b = tf.ones_like(a)
c = tf.zeros_like(a)

d = tf.where(mask,b,c)
print("d:",d.numpy())
4. tf.scatter_nd
# **************** tf.scatter_nd
"""
以全为0的shape底板根据indices来更新updates
"""
# 一维举例
indices = tf.constant([[4],[3],[1],[7]])
updates = tf.constant([9,10,11,12])
shape = tf.constant([8])

a = tf.scatter_nd(indices,updates,shape)
print("a:",a.numpy())

# 多维举例
updates = tf.random.normal([2,4,4])
indices = tf.constant([[0],[2]])
shape = tf.constant([4,4,4])

b = tf.scatter_nd(indices,updates,shape)
print("b:",b.numpy())
5. meshgrid方法
# ********************* meshgrid
x = tf.linspace(-2.,2.,5)
y = tf.linspace(-2.,2.,5)

X,Y = tf.meshgrid(x,y)
print("X:",X)
print("Y:",Y)

points1 = tf.stack([X,Y],axis = 2)
print("points1:",points1.numpy())

points = tf.reshape(points1,[-1,2])
print("points:",points.numpy())
"""
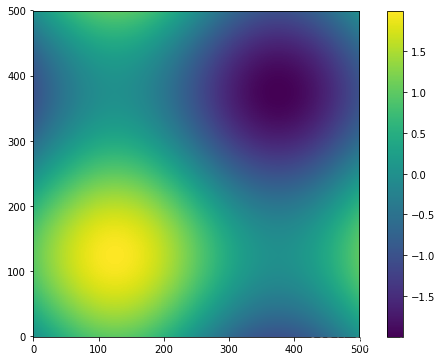
6. 绘制等高线图
import matplotlib.pyplot as plt
from mpl_toolkits.mplot3d import Axes3D
def func(x):
return tf.math.sin(x[...,0])+tf.math.sin(x[...,1])
x = tf.linspace(0,2*tf.constant(np.pi),500)
y = tf.linspace(0,2*tf.constant(np.pi),500)
X,Y = tf.meshgrid(x,y)
points = tf.reshape(tf.stack([X,Y],axis = 2),[-1,2])
Z = tf.reshape(func(points),[500,500])
fig = plt.figure(figsize=([10,6]))
plt.imshow(Z,origin="lower")
plt.colorbar()
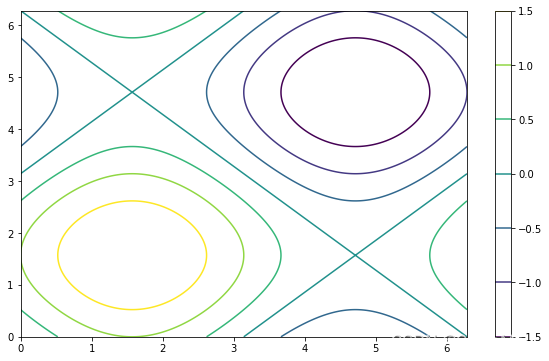
fig = plt.figure(figsize=([10,6]))
plt.contour(X,Y,Z)
plt.colorbar()
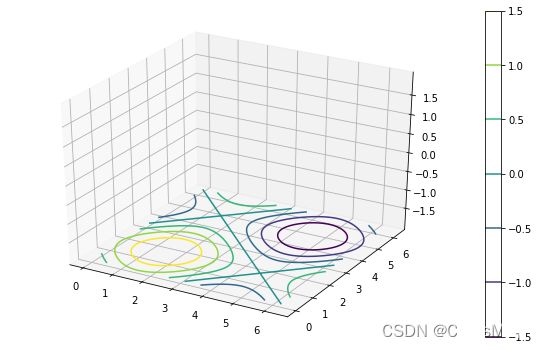
fig = plt.figure(figsize=([10,6]))
ax = fig.add_subplot(111,projection = "3d")
image = ax.contour(X,Y,Z,zdir = "z",offset = -2)
fig.colorbar(image)
plt.show()
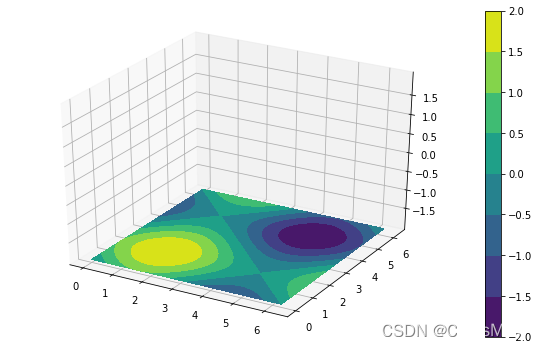
fig = plt.figure(figsize=([10,6]))
ax = fig.add_subplot(111,projection = "3d")
image = ax.contourf(X,Y,Z,zdir = "z",offset = -2)
fig.colorbar(image)
plt.show()
本文为参考龙龙老师的“深度学习与TensorFlow 2入门实战“课程书写的学习笔记
by CyrusMay 2022 04 16


 1091
1091

 被折叠的 条评论
为什么被折叠?
被折叠的 条评论
为什么被折叠?
 到【灌水乐园】发言


