


 本文介绍了如何使用Spring Cloud Sleuth进行微服务追踪,并结合Zipkin展示调用链路。Sleuth通过Span和Trace记录请求细节,Annotation用于标记请求关键事件。通过在项目中引入Sleuth依赖并配置,可以收集服务间的调用信息。同时,整合Zipkin可以将追踪数据可视化,便于问题定位。只需简单配置Zipkin的Docker容器和项目依赖,即可实现追踪数据的收集与展示。
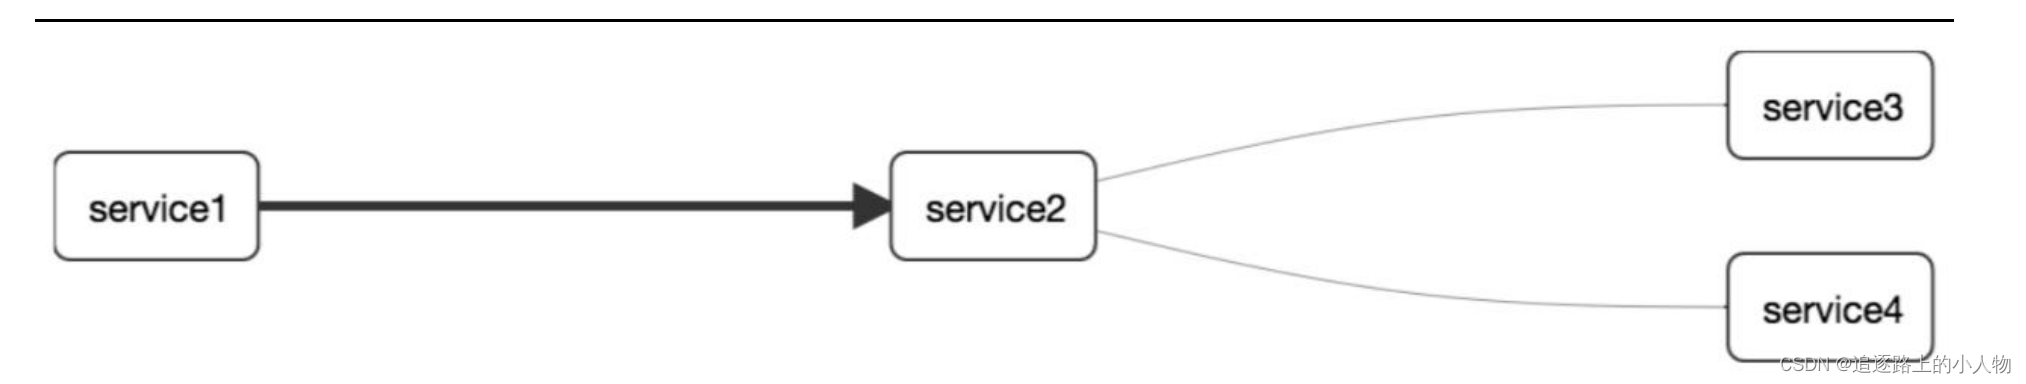
1、为什么用
解决:一个请求调用多个服务。出现错误不好定位。
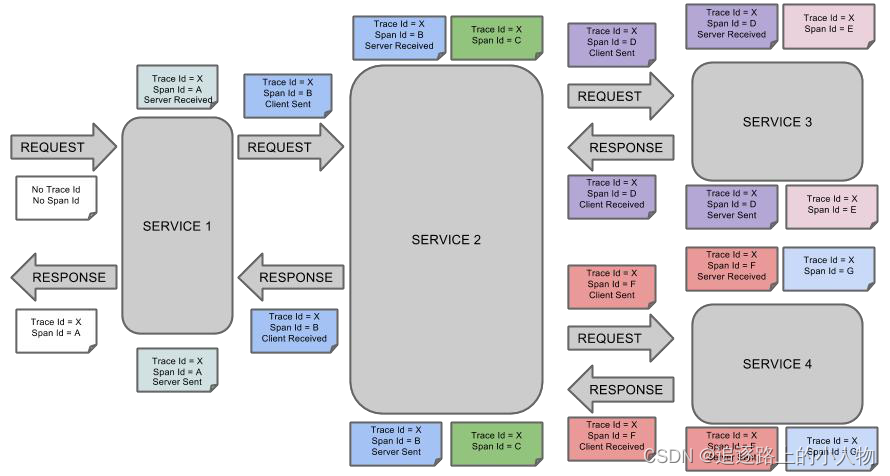
2、基本术语
Span(跨度):基本工作单元,发送一个远程调度任务 就会产生一个 Span,Span 是一
个 64 位 ID 唯一标识的,Trace 是用另一个 64 位 ID 唯一标识的,Span 还有其他数据信
息,比如摘要、时间戳事件、Span 的 ID、以及进度 ID。
Trace(跟踪):一系列 Span 组成的一个树状结构。请求一个微服务系统的 API 接口,
这个 API 接口,需要调用多个微服务,调用每个微服务都会产生一个新的 Span,所有
由这个请求产生的 Span 组成了这个 Trace。
Annotation(标注):用来及时记录一个事件的,一些核心注解用来定义一个请求的开
始和结束 。这些注解包括以下:
cs - Client Sent -客户端发送一个请求,这个注解描述了这个 Span 的开始
sr - Server Received -服务端获得请求并准备开始处理它,如果将其 sr 减去 cs 时间戳
便可得到网络传输的时间。
ss - Server Sent (服务端发送响应)–该注解表明请求处理的完成(当请求返回客户
端),如果 ss 的时间戳减去 sr 时间戳,就可以得到服务器请求的时间。
cr - Client Received (客户端接收响应)-此时 Span 的结束,如果 cr 的时间戳减去
cs 时间戳便可以得到整个请求所消耗的时间。
官方文档:
https://cloud.spring.io/spring-cloud-static/spring-cloud-sleuth/2.1.3.RELEASE/single/spring-cloud
-sleuth.html
trace>span
3、整合Sleuth
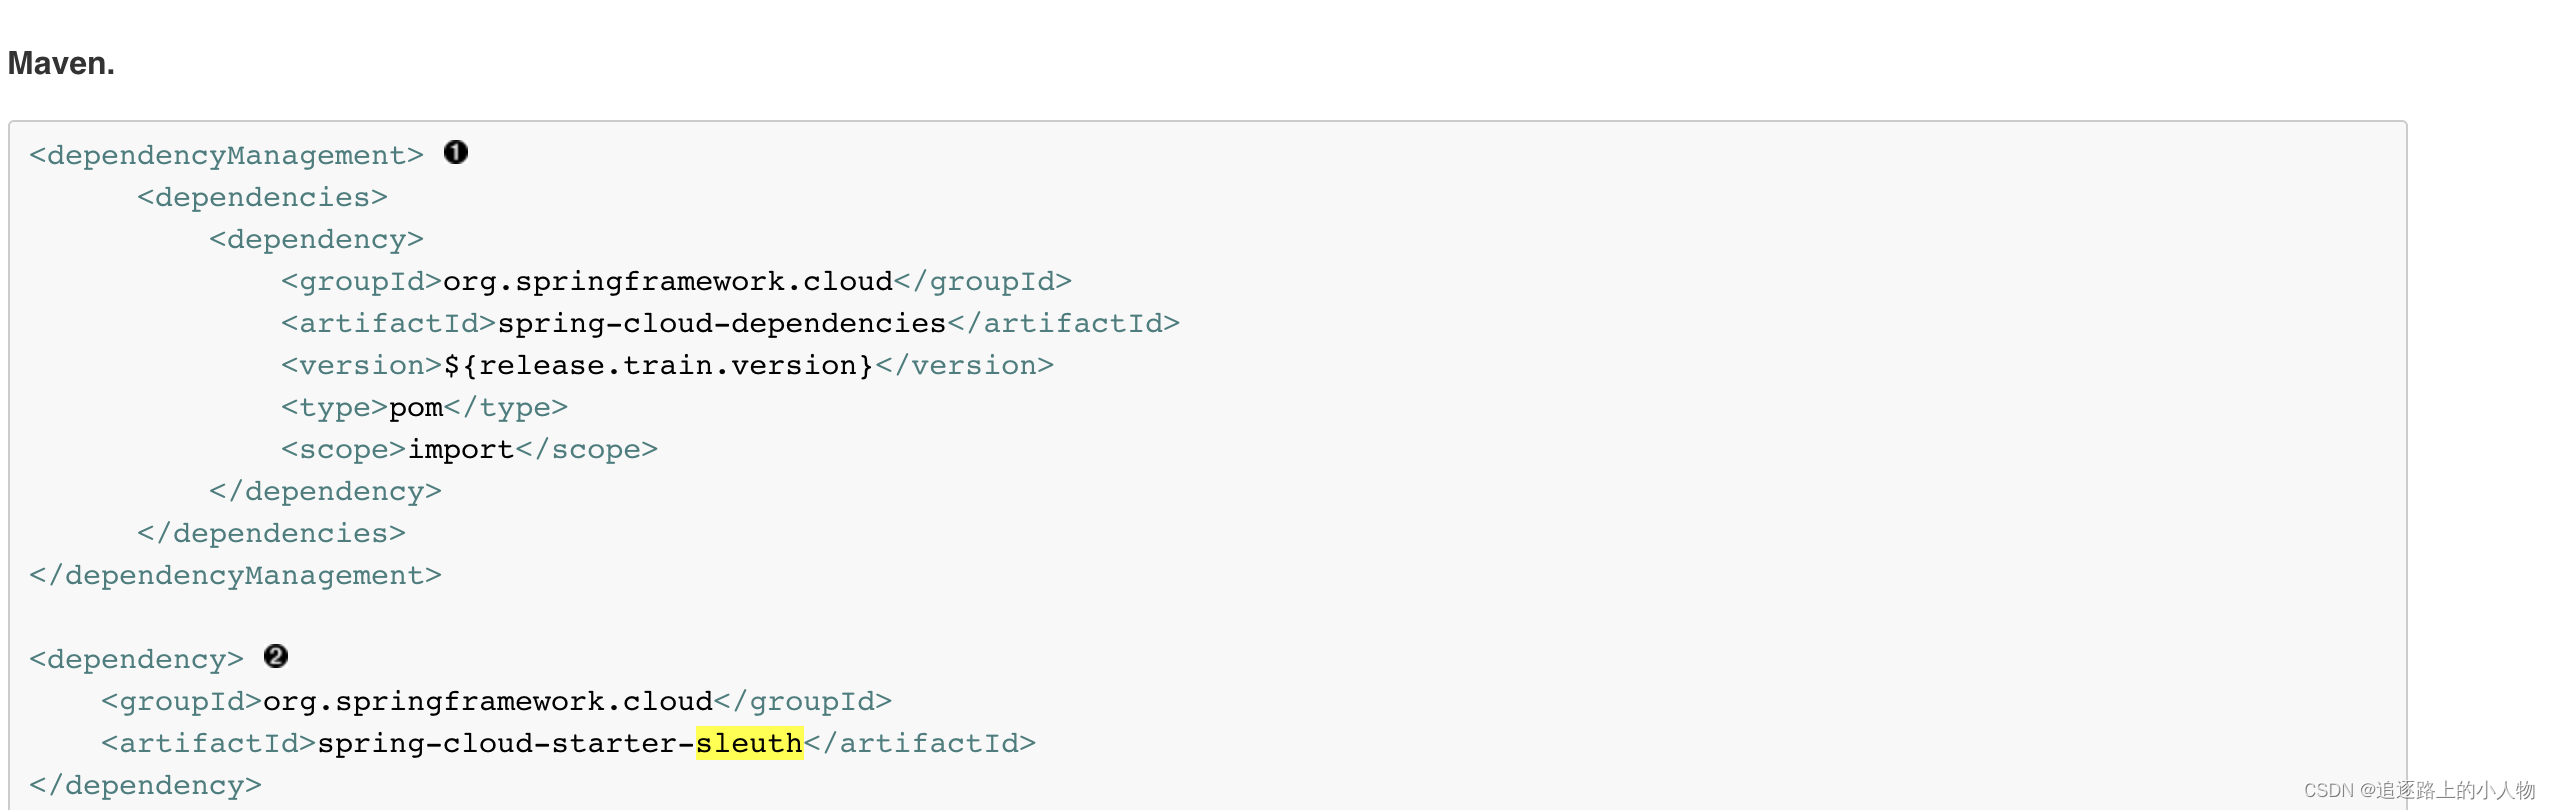
<dependency>
<groupId>org.springframework.cloud</groupId>
<artifactId>spring-cloud-starter-sleuth</artifactId>
</dependency>
配置
logging.level.org.springframework.cloud.openfeign=debug
logging.level.org.springframework.cloud.sleuth=debug
4、整合zipkin
1)、下载
docker 安装 zipkin 服务器
docker run -d -p 9411:9411 openzipkin/zipkin
2)、
<dependency>
<groupId>org.springframework.cloud</groupId>
<artifactId>spring-cloud-starter-zipkin</artifactId>
</dependency>
#spring.zipkin.base-url=http://10.211.55.7:9411/
#spring.zipkin.discovery-client-enabled=false
#spring.zipkin.sender.type=web
#spring.sleuth.sampler.probability=1


 8515
8515

 被折叠的 条评论
为什么被折叠?
被折叠的 条评论
为什么被折叠?
 到【灌水乐园】发言


