


 本文介绍了如何在Zabbix中自定义监控Linux服务器上的HTTP服务和Nginx,包括通过三剑客获取活跃连接数,修改配置文件添加监控项,以及在Web界面进行设置和调整字体,确保汉字正常显示。同时,展示了如何监控接收到的请求和处理的请求,并观察图形变化及趋势存储时间。
自定义监控项
监控server2上的http
yum install httpd -y
systemctl start httpd
systemctl enable httpd
监控server3上的nginx
cd nginx-1.17.8/
yum install gcc pcre-devel zlib-devel -y
./configure --prefix=/usr/local/nginx --with-http_stub_status_module
注意编译监控模块
make && make install
cd /usr/local/nginx/conf/
ln -s /usr/local/nginx/sbin/nginx /usr/local/sbin/
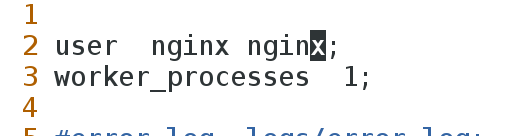
vim nginx.conf
useradd -u 900 nginx
nginx
netstat -antlp|grep nginx


curl http://127.0.0.1/status
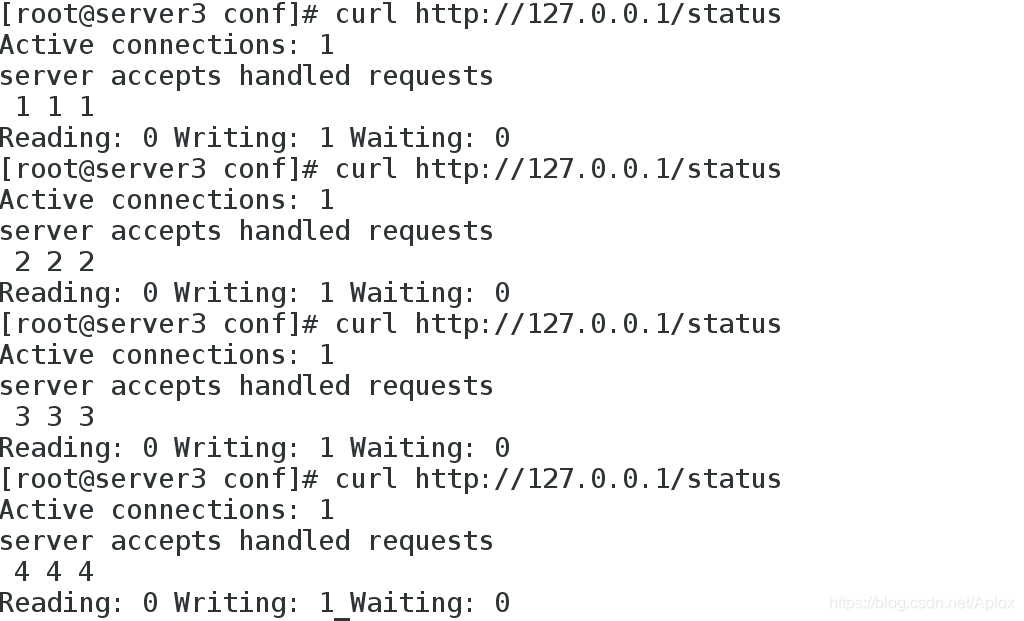
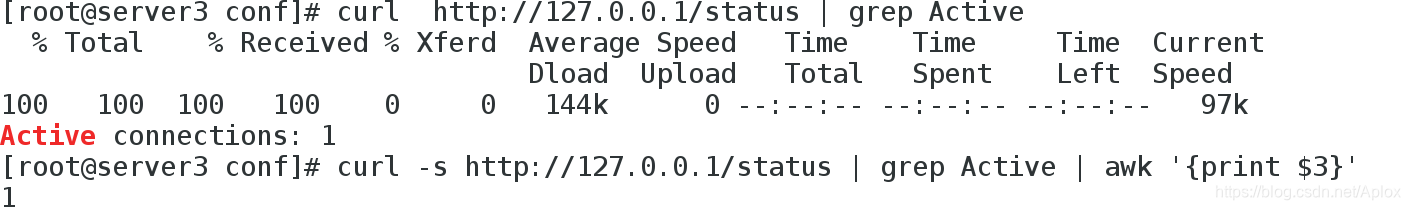
通过三剑客来获取活跃的连接数的数值
curl -s http://127.0.0.1/status | grep Active | awk '{print $3}'
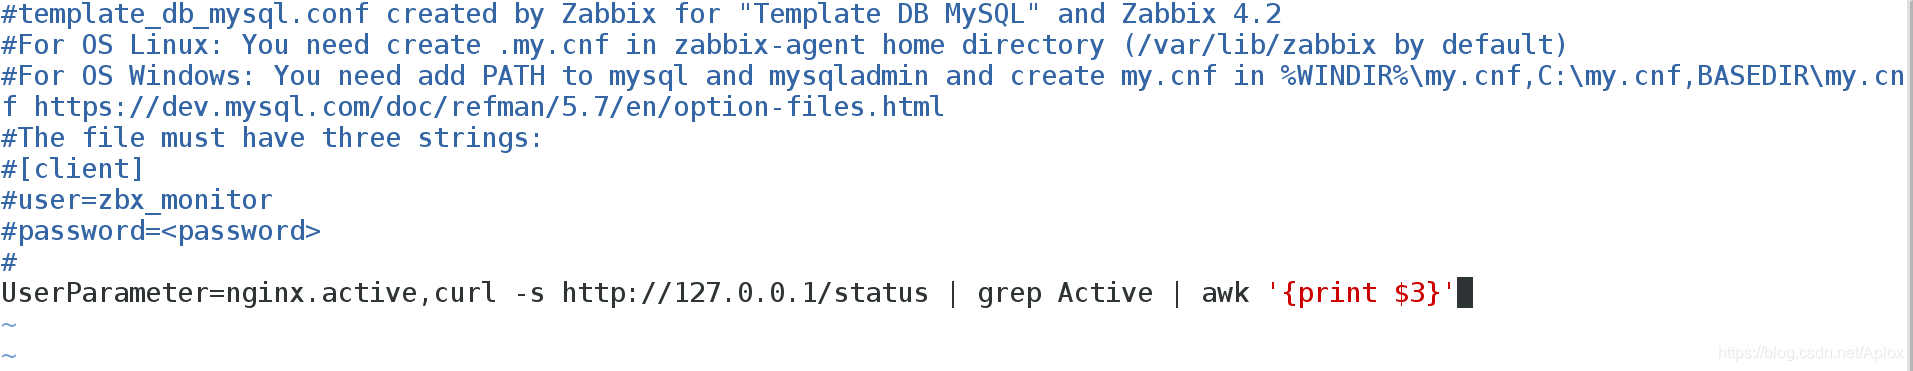
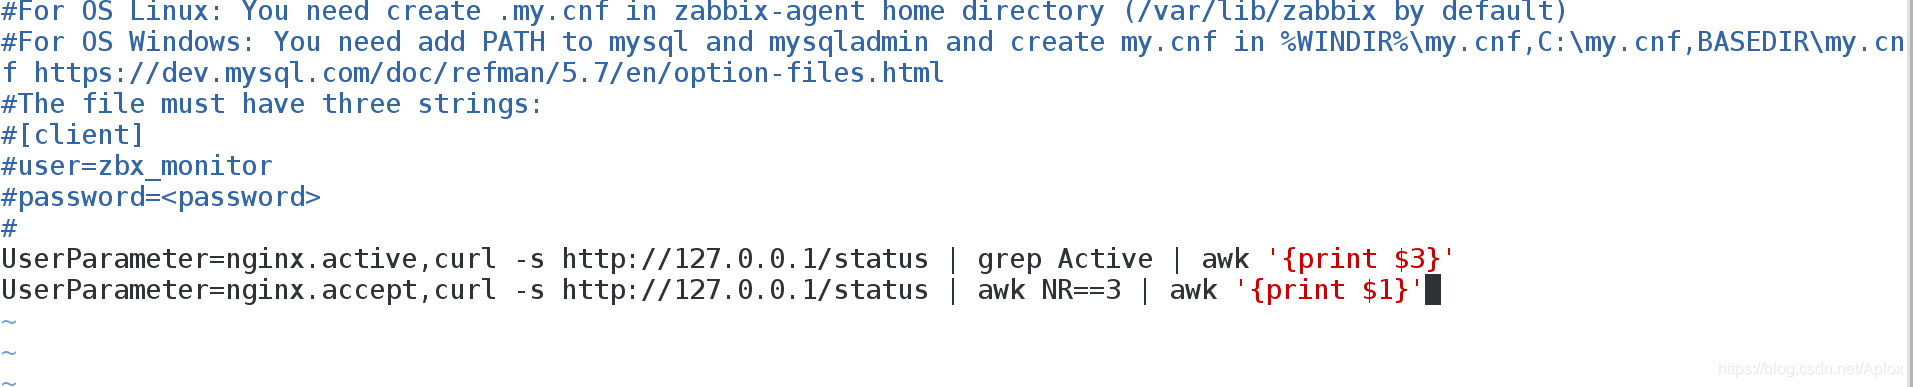
修改server3的配置文件/etc/zabbix/zabbix_agentd.d/userparameter_nginx.conf,创建nginx的监控项
cd /etc/zabbix/zabbix_agentd.d/
cp userparameter_mysql.conf userparameter_nginx.conf
vim userparameter_nginx.conf
systemctl restart zabbix-agent
在server1上装获取数据的包:
yum install zabbix-get-4.4.1-1.el7.x86_64.rpm -y
zabbix_get -s 172.25.254.3 -p 10050 -k "nginx.active"

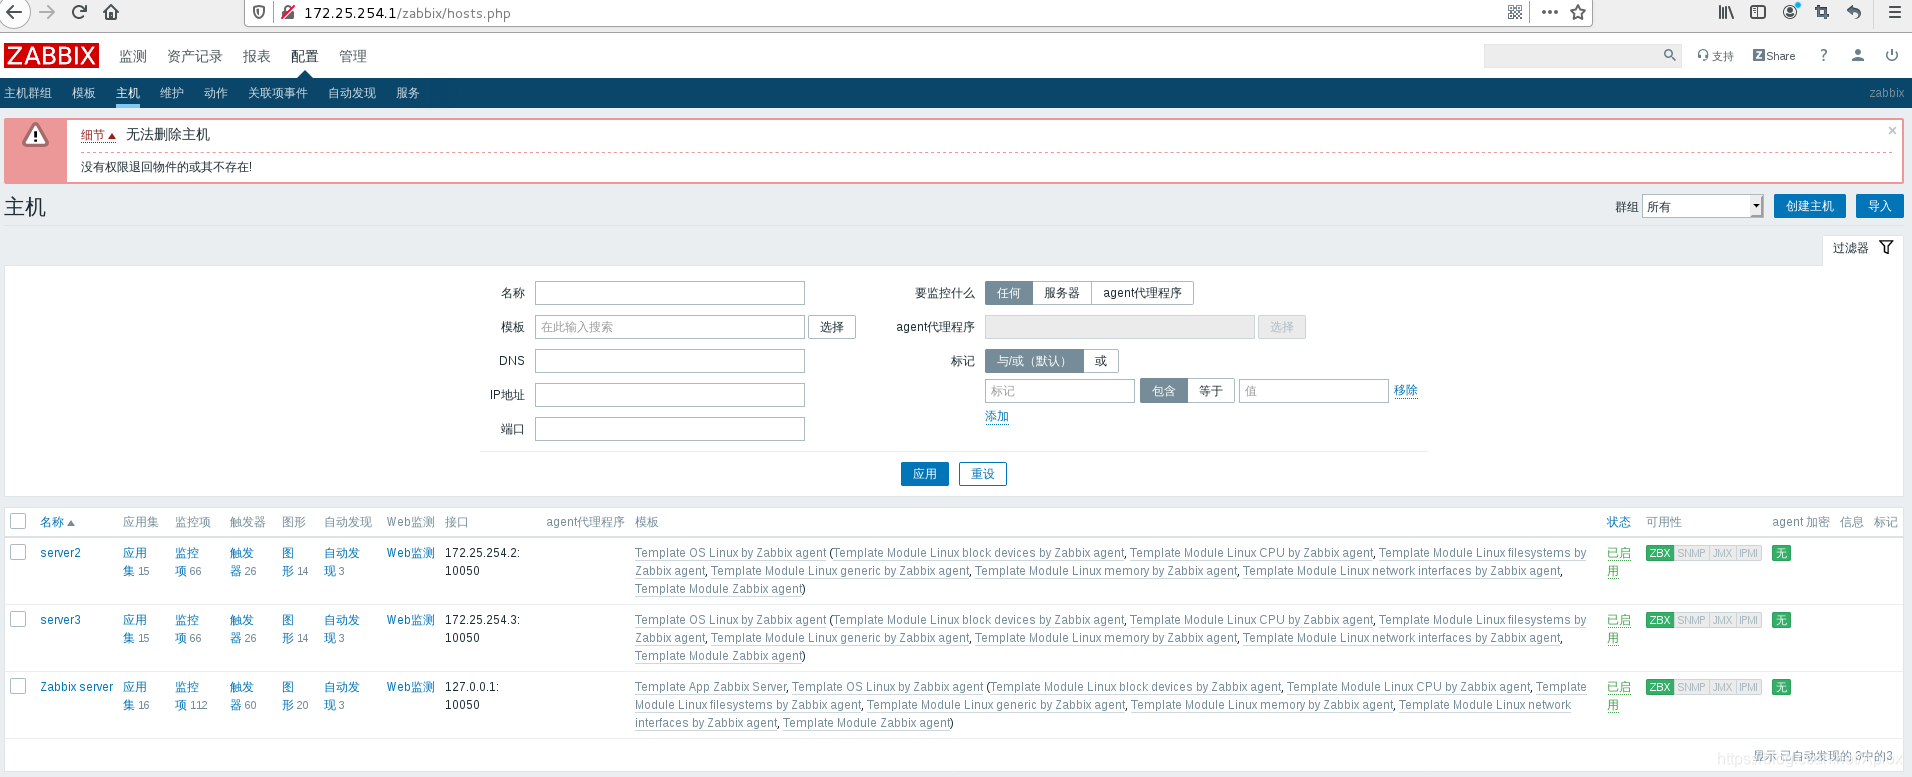
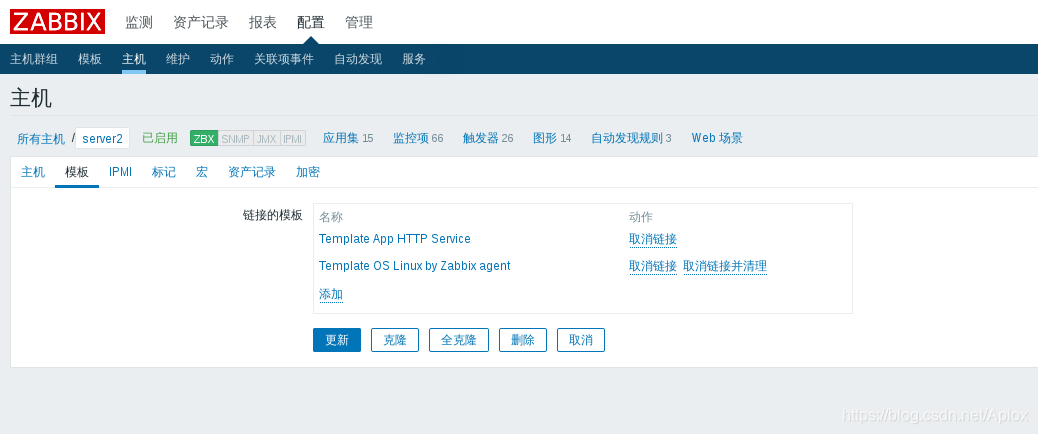
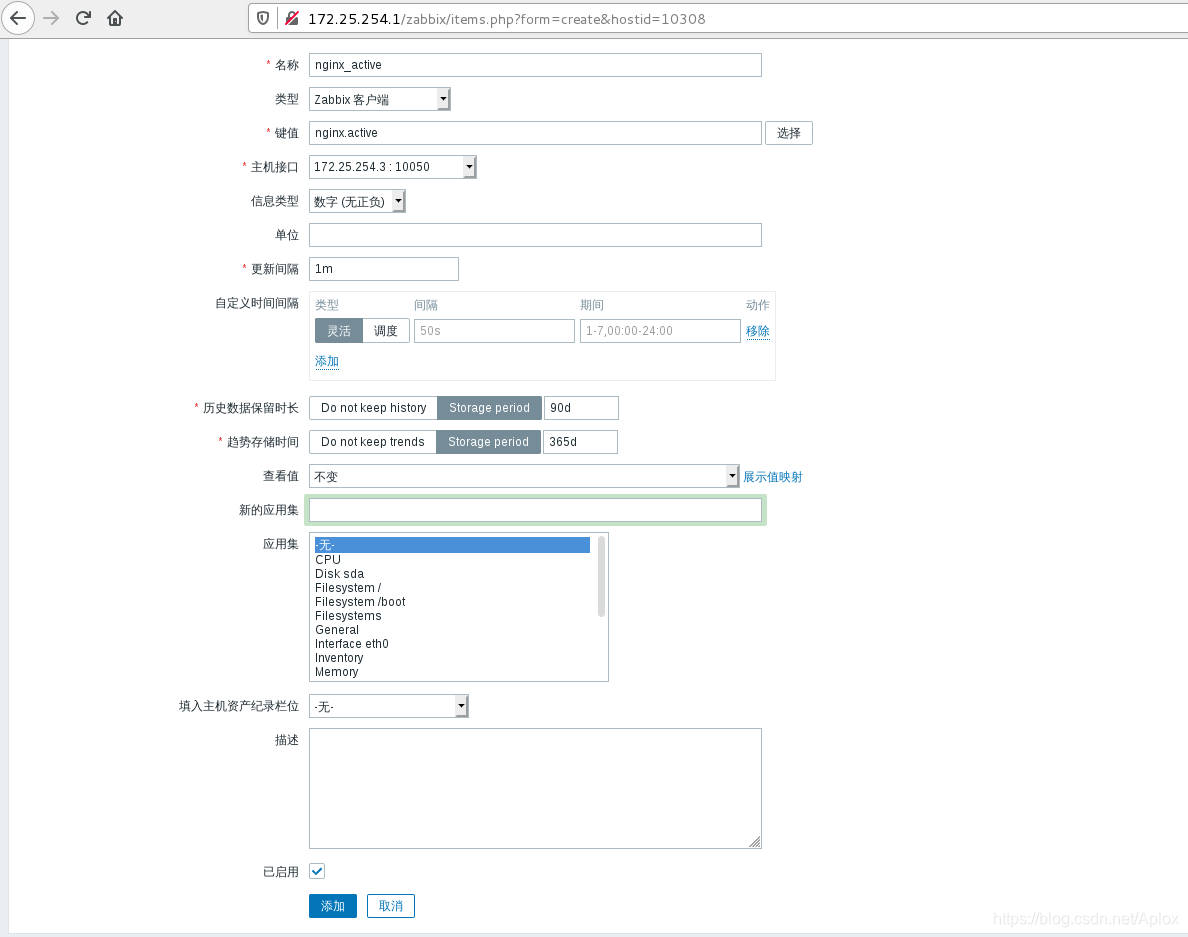
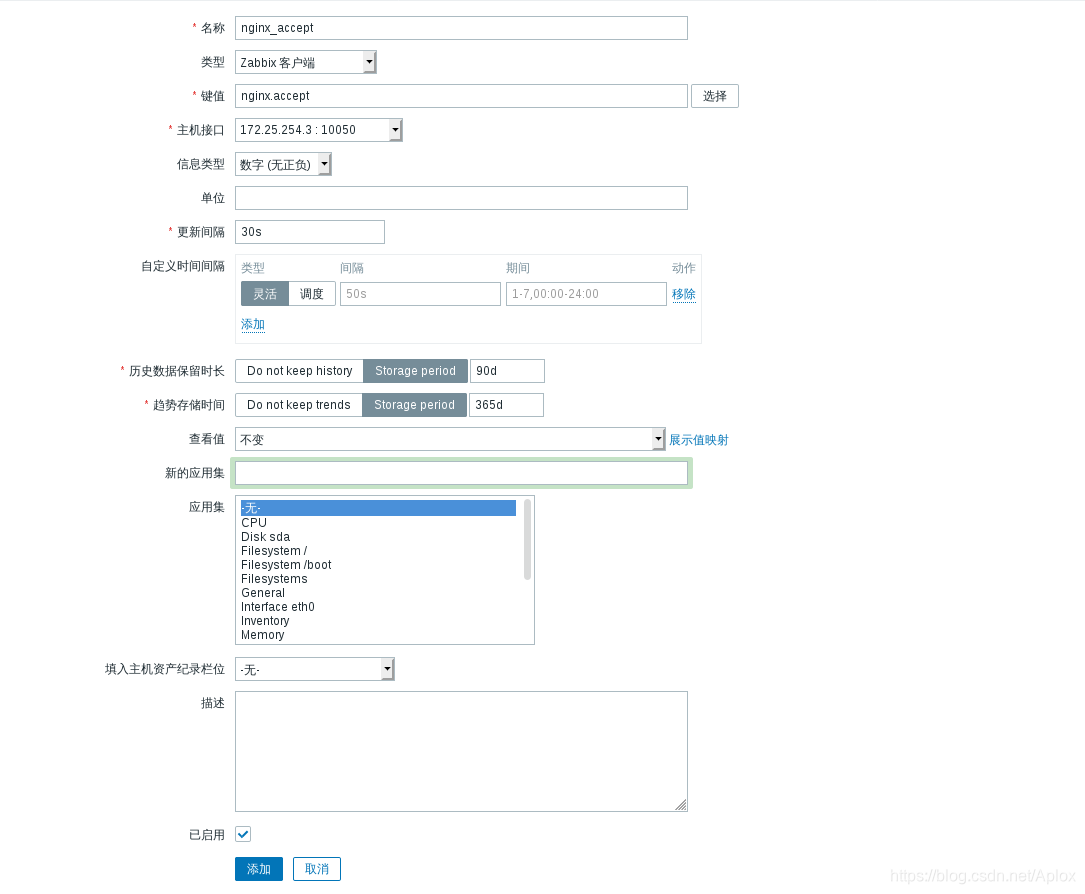
在web界面设置
点击主机 server3 监控项 创建监控项
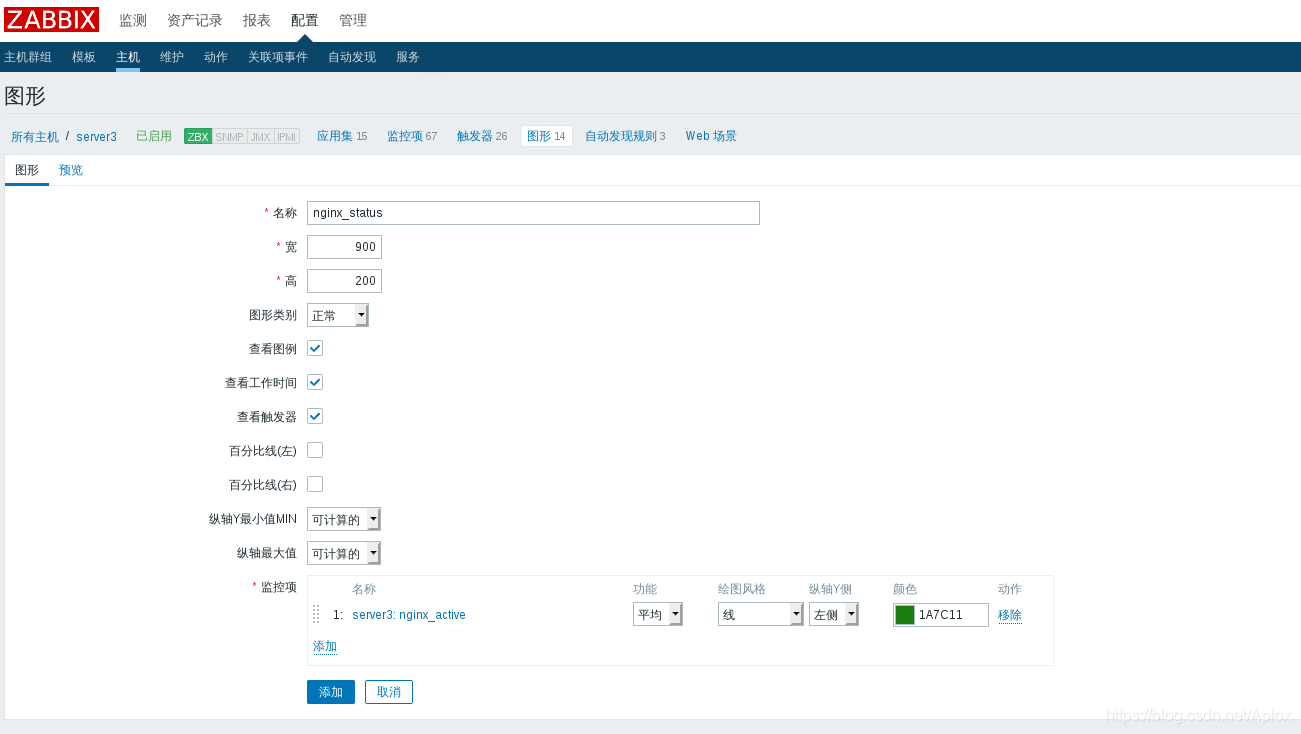
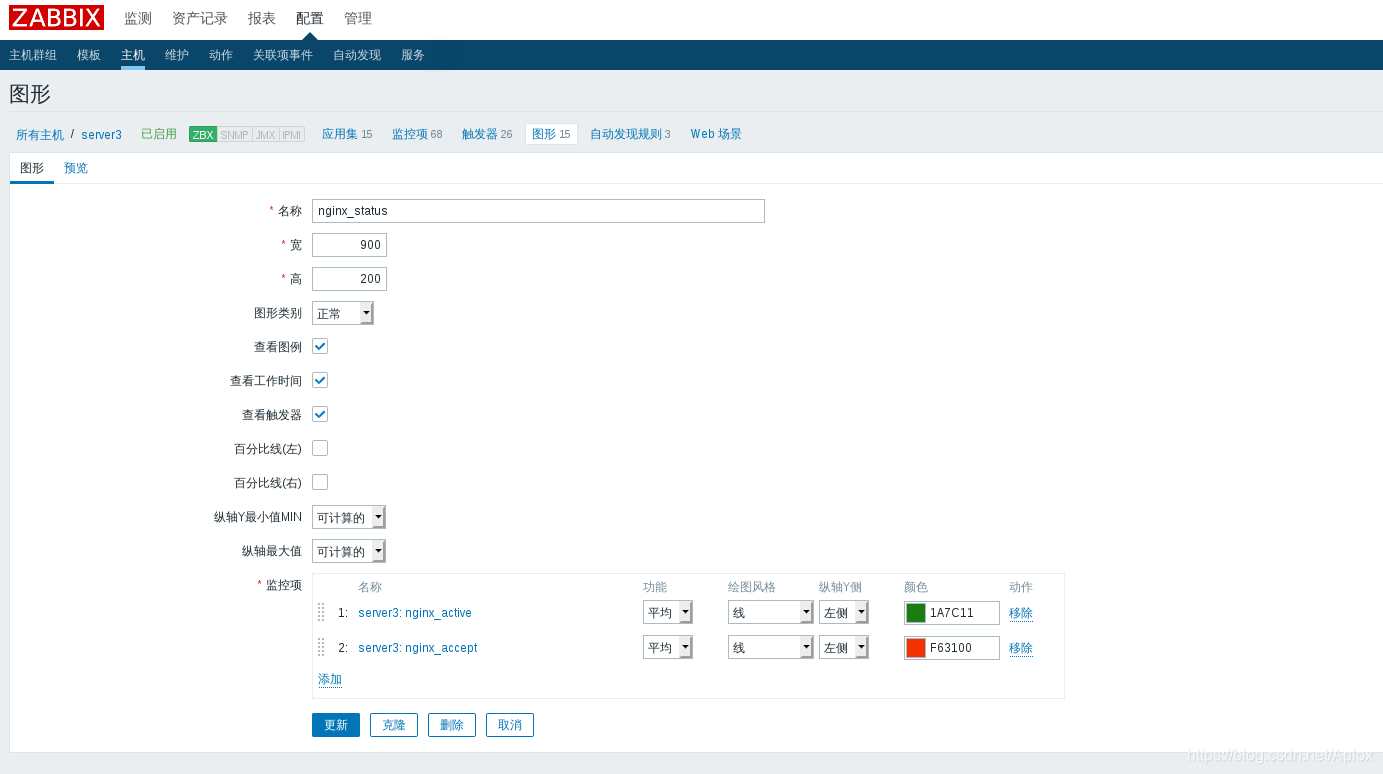
创建图形
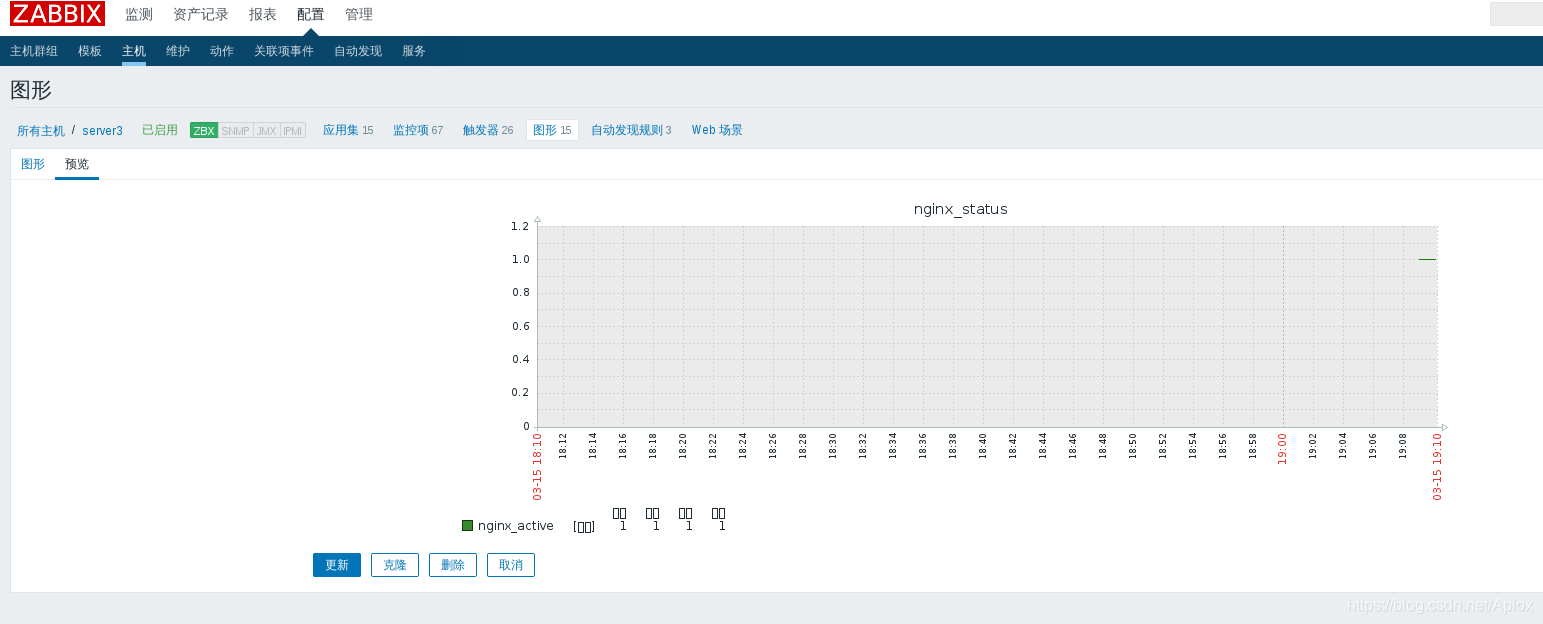
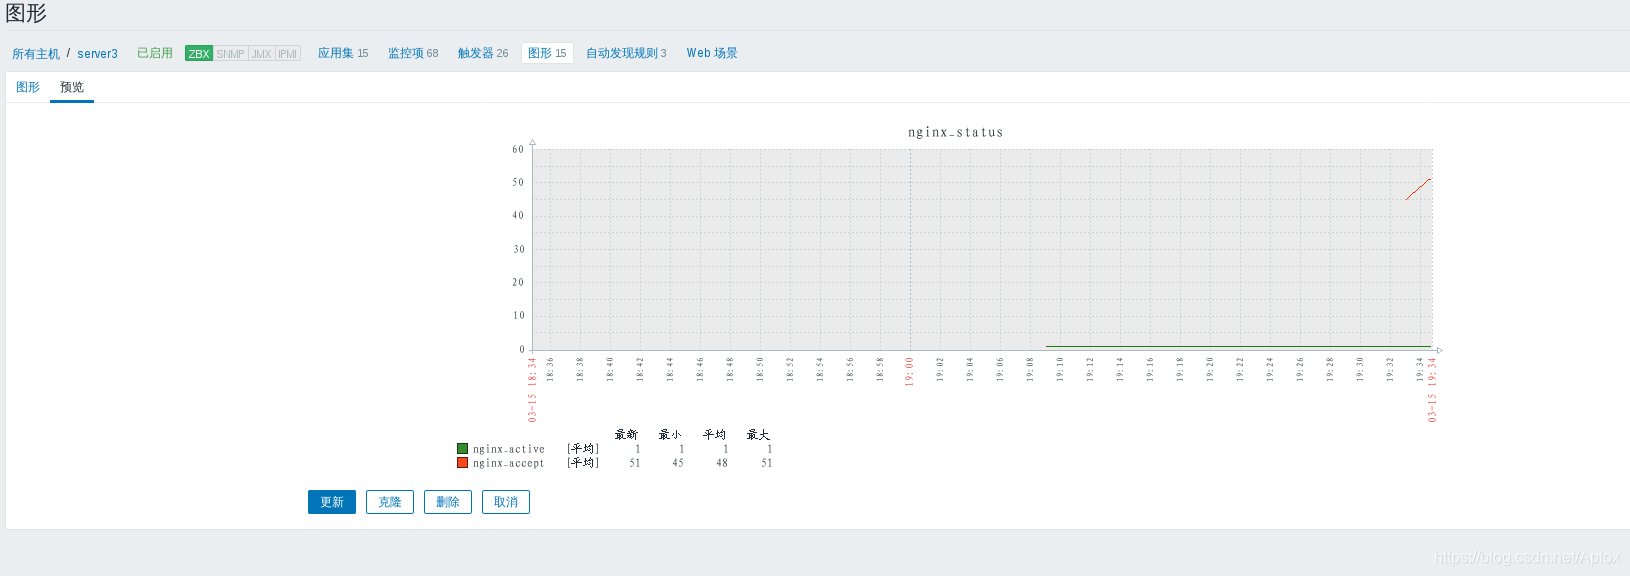
点击nginx_active,预览
汉字无法显示
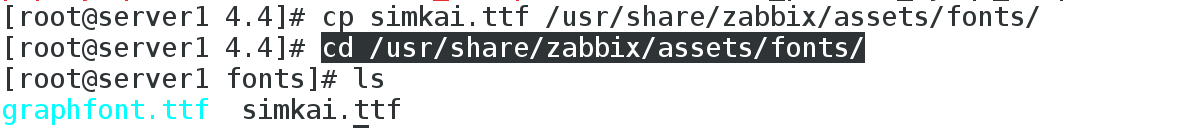
web界面字体的调整
cp simkai.ttf /usr/share/zabbix/assets/fonts/
cd /usr/share/zabbix/assets/fonts/
cd /usr/share/zabbix/include/
vim defines.inc.php
:%s/graphfont/simkai/g 将graphfont替换为simkai
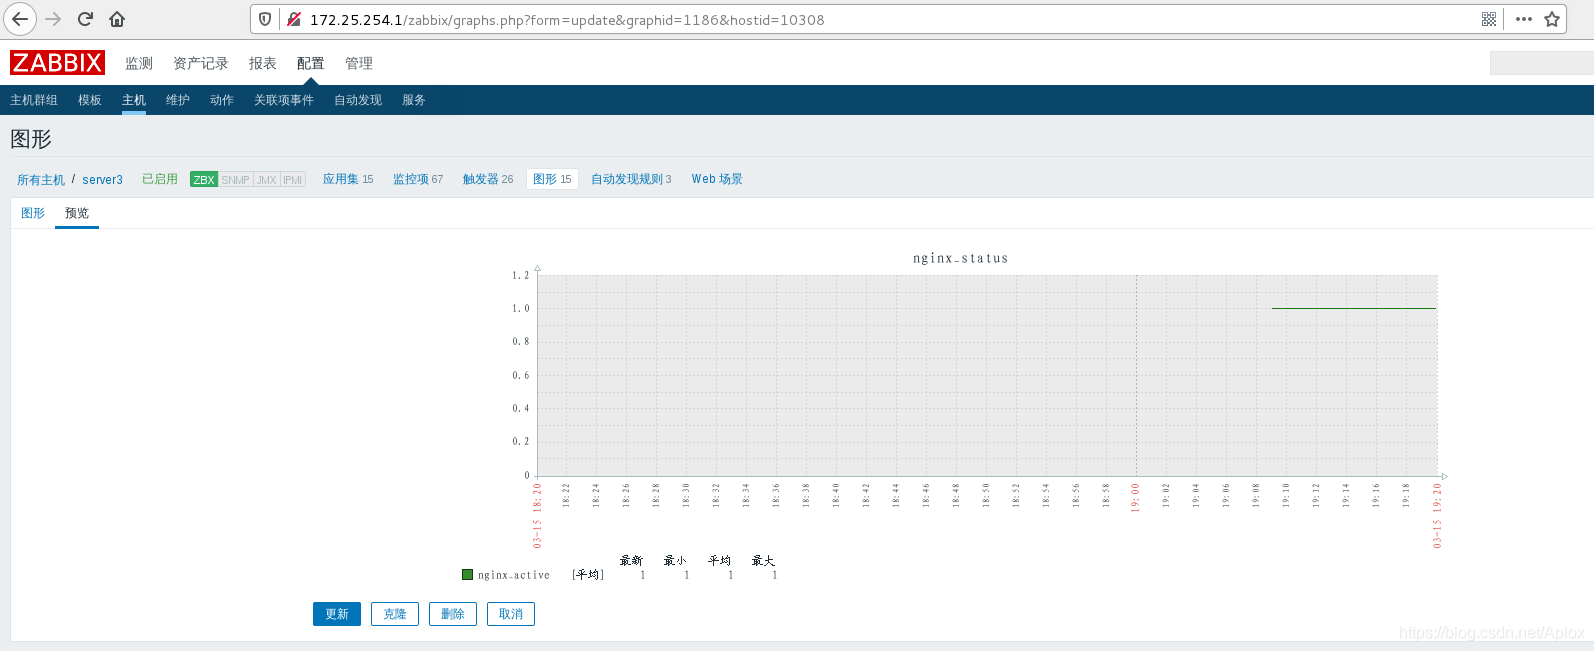
此时,在web界面刷新图形,字体显示位中文
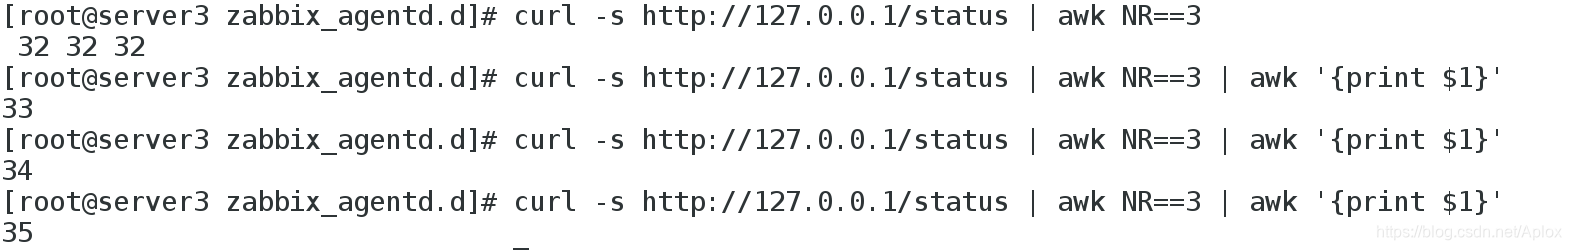
在server3继续使用三剑客 获取接收到的请求数(accept)和处理的请求数(request)
curl -s http://127.0.0.1/status | awk NR==3
curl -s http://127.0.0.1/status | awk NR==3 | awk '{print $1}'
vim userparameter_nginx.conf
systemctl restart zabbix-agent
在server1测试获取

再添加监控项
将此监控放到同一张图上
增加一些访问
[root@foundation38 Downloads] ab -c 1 -n 1000 http://172.25.254.3/index.html
图形有变化
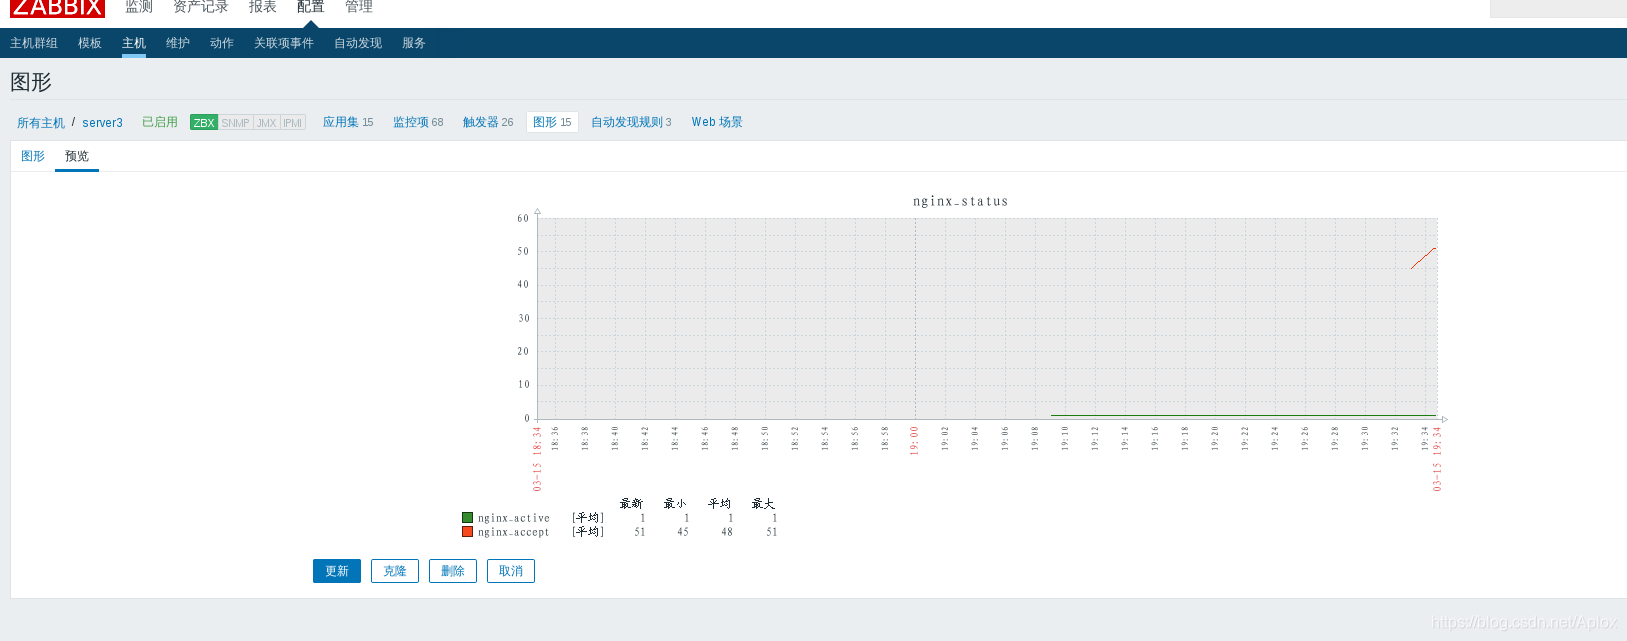
趋势存储时间:每个小时收集到的最大值 最小值 平均值 ,以及数量


 556
556

 被折叠的 条评论
为什么被折叠?
被折叠的 条评论
为什么被折叠?
 到【灌水乐园】发言


