


 本文介绍如何在Android中使用MpAndroidChart库在Fragment中创建堆叠柱状图,通过展示XML布局和Fragment代码,揭示了一个常见的错误实现,并分享了正确的实现方式。
自己查资料的时候发现,MpAndroidChart对于StackBar有另一种实现方式
堆叠图还是使用BarChart作为基础,我是写在Frgment中的。
效果如下:

layout.xml文件:
    <com.github.mikephil.charting.charts.BarChart
        android:id="@+id/barchart"
        android:layout_width="match_parent"
        android:layout_height="match_parent">
    </com.github.mikephil.charting.charts.BarChart>
Fragment文件:
public class TestFragmetn extends Fragment {
    private BarChart barchart;

    @Nullable
    @Override
    public View onCreateView(LayoutInflater inflater,
    @Nullable ViewGroup container, @Nullable Bundle savedInstanceState) {
        View view = inflater.inflate(R.layout.q15testbar, null);
        initView(view);
        initChart();
        return view;
    }

    private void initView(View view) {
        barchart = (BarChart) view.findViewById(R.id.barchart);
    }
    private void initChart(){
        List<BarEntry> yvalue=new ArrayList<>();
        //敲黑板啦!!这里才是重点部分,可以添加一个float数组,让它变成StackBar
        yvalue.add(new BarEntry(new float[]{123,455},0));
        yvalue.add(new BarEntry(new float[]{35,325},1));
        yvalue.add(new BarEntry(new float[]{12,95},2));
        yvalue.add(new BarEntry(new float[]{122,195},3));
        BarDataSet set=new BarDataSet(yvalue,"");
        set.setColors(new int[]{Color.RED,Color.GREEN,Color.rgb(122,32,16)});//set会循环这里的颜色进行添加
        List<String> xvalue=new ArrayList<>();
        xvalue.add("第一季度");
        xvalue.add("第二季度");
        xvalue.add("第三季度");
        xvalue.add("第四季度");
        BarData data=new BarData(xvalue,set);
        barchart.setData(data);
    }
}
这里顺带提一下我才过的坑。
因为之前用LineDataSet的时候发现LineDataSet可以传入一个List<>,我想,如果通过这个方式,是否也可以实现stackBar呢。
所以有了以下代码:
 private void initChart(){
        List<BarEntry> yvalue=new ArrayList<>();
        List<BarEntry> yvalue2=new ArrayList<>();
        List<BarEntry> yvalue3=new ArrayList<>();
        yvalue.add(new BarEntry(123f,0));
        yvalue2.add(new BarEntry(35f,0));
        BarDataSet set=new BarDataSet(yvalue,"");
        BarDataSet set1=new BarDataSet(yvalue2,"");
        //声明一个List<BarDataSet>,将这几个set传入其中。
        List<BarDataSet> sets=new ArrayList<>();
        sets.add(set);
        sets.add(set1);
        set.setColors(new int[]{Color.RED,Color.GREEN,Color.rgb(122,32,16)});
        List<String> xvalue=new ArrayList<>();
        xvalue.add("第一季度");
        xvalue.add("第二季度");
        BarData data=new BarData(xvalue,sets);
        barchart.setData(data);
    }
先上效果图:
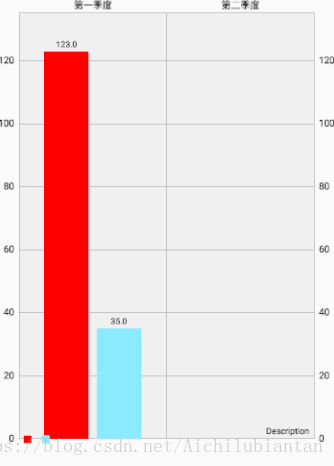
很明显,与我们想要的完全不一样
在这里变成了一个坐标下面存在两个数据了,与我们想要的完全不一样好不啦。手动再见。


 被折叠的 条评论
为什么被折叠?
被折叠的 条评论
为什么被折叠?
 到【灌水乐园】发言


