


 该博客主要介绍使用Python和Matplotlib绘图。先导入基本模块并设置成中文,接着准备数据,然后进行绘图,设置画布中文标题为“花瓣图”,字号40且颜色为红色,最后展示图表。
#导入基本模块并设置成中文
#%matplotlib auto
import numpy as np
import matplotlib.pyplot as plt
plt.rcParams['font.sans-serif'] = ["SimHei"]
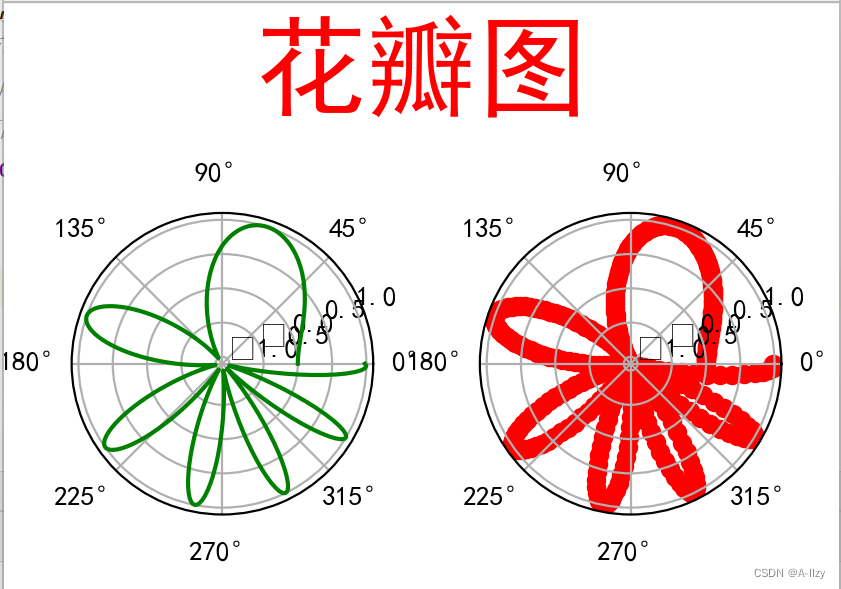
#准备数据
theta = np.linspace(0, 2*np.pi, 400)
r = np.sin(theta**2)
#绘图
fig,axs=plt.subplots(nrows=1,ncols=2,subplot_kw=dict(projection='polar'))
#只能用subplots()绘图,查看subplots的官网API文档,利用subplot_kw参数控制坐标系类型,即投影方式
print(axs)
axs[0].plot(theta,r,color='g')
axs[1].scatter(theta,r,color='r')
# 必须利用subplots(),而不能利用subplot()
#设置画布中文标题“花瓣图”(字号40,颜色为红色)
fig.suptitle('花瓣图',fontsize=40,color='r')
#展示图表
plt.tight_layout()
plt.show()


 被折叠的 条评论
为什么被折叠?
被折叠的 条评论
为什么被折叠?
 到【灌水乐园】发言


