


查看慢sql日志是否开启
-- 查看慢查询是否开启 on代表开启
show variables like '%slow_query_log%';

set global slow_query_log_file='D:/log/mysql/slow.log';
分析sql语句执行时间
第一步
# 查看是否开启
show variables like 'profiling';
# 开启语句
set profiling=1;

第二步
# 随便执行一条语句,尽量是那种全盘扫描,时间稍微长点的
select  * from tbl_dept;
执行
show profiles;
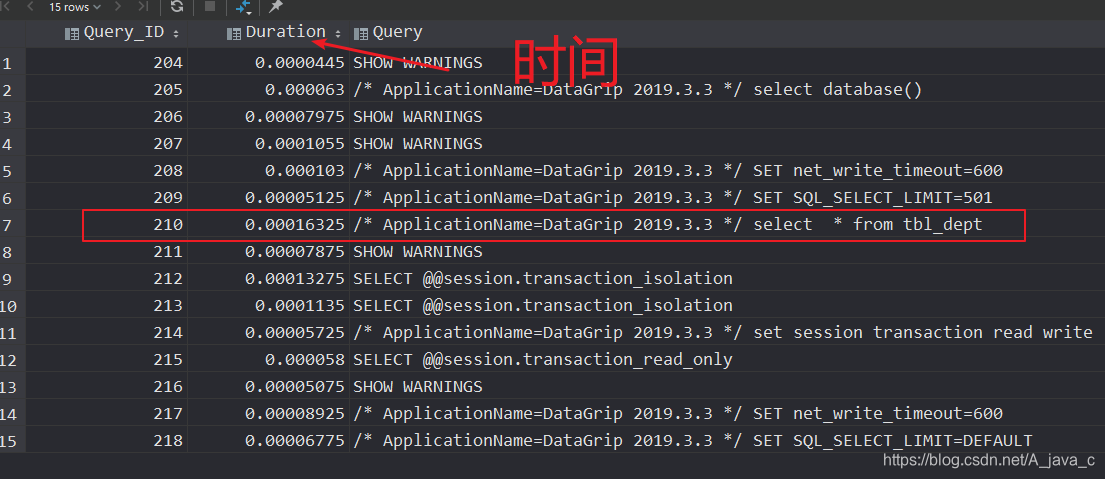
第三步:查看具体耗时时间
show profile cpu,block io for query 102;
查看哪里用的时间长

 840


 扫一扫


 被折叠的 条评论
为什么被折叠?
 到【灌水乐园】发言


