


在
http://www.tianqihoubao.com/lishi/baoding/month/202010.html
爬取保定2021-2024的天气,并存入表中,供其他程序分析。
启动命令:
scrapy crawl weather
爬取数据内容:日期、夜间/白天天气状况、夜间/白天最低气温、夜间 /白天最高气温、夜间/白天风力、夜间/白天风向。
爬虫实现思路:分析数据来源页面,将爬取的页面进行数据解析和提 取,将提取的数据存储到Excel中,搭配pandas、matplotlib,将写入本地的Excel数据进行数据处理分析,可视化呈现分析 结果
项目完整地址:GitHub - haoyangjunjun/Scrapy-Test-project
spider代码
import scrapy
from scrapy import Selector, Request
from scrapy.http import HtmlResponse

from scrapy_Test_project.items import MovieItem


class WeatherSpider(scrapy.Spider):
    name = 'weather'
    allowed_domains = ["tianqihoubao.com"]
    # start_urls = ["http://www.tianqihoubao.com/lishi/baoding/month/202301.html"]
    def start_requests(self):
        for year in range(2021, 2025):
            for month in range(1, 13):  # 月份从 1 到 12
                # 格式化月份为两位数,例如 '01', '02', ..., '12'
                formatted_month = f'{month:02d}'
                # 构造完整的 URL
                url = f'http://www.tianqihoubao.com/lishi/baoding/month/{year}{formatted_month}.html'
                # 生成并返回 Request 对象
                yield Request(url=url)  # 假设您有一个名为 parse 的回调方法

    def parse(self, response: HtmlResponse, **kwargs):
        # 定位表格
        table = response.css('table:first-of-type')
        # 遍历表格的每一行
        for row in table.css('tr'):
            # 提取每一列的数据
            date = row.css('td:nth-child(1)::text').get()
            weather = row.css('td:nth-child(2)::text').get()
            temp_range = row.css('td:nth-child(3)::text').get()
            wind = row.css('td:nth-child(4)::text').get()

            # 创建一个字典来存储数据
            yield {
                'date': date,
                'weather': weather,
                'temp_range': temp_range,
                'wind': wind,
            }
数据整理
import pandas as pd

# 读取Excel文件
file_path = 'weather_data.xlsx'
df = pd.read_excel(file_path, header=0)  # 列名
df = df.dropna(subset=['Date', 'Weather', 'Temp Range', 'Wind'], how='all')
df['Date'] = pd.to_datetime(df['Date'].str.replace('年', '-').str.replace('月', '-').str.replace('日', ''), format='%Y-%m-%d')
df = df.set_index('Date')
df = df.sort_index()  # 对DataFrame进行排序
# 数据保存回Excel文件


# 打印DataFrame的列名,以便检查
print("DataFrame列名:", df.columns.tolist())
output_file_path = 'weather_data.xlsx'
df.to_excel(output_file_path)
print("数据已排序并保存到", output_file_path)
数据分析
import pandas as pd
import matplotlib as mpl
import matplotlib.pyplot as plt
import matplotlib
matplotlib.use('TkAgg')
import numpy as np
# 读取xlsx文件
file_path = 'weather_data.xlsx'
df = pd.read_excel(file_path)
# 数据清洗和预处理
# 转换日期列为datetime类型,并设置为索引
# df['Date'] = pd.to_datetime(df['Date'].str.replace('年', '-').str.replace('月', '-').str.replace('日', ''), format='%Y-%m-%d')
df.set_index('Date', inplace=True)
# 提取最高气温、最低气温和风力等级
def extract_temp_and_wind(row):
temp_range_str = str(row['Temp Range'])
temp_range_clean = temp_range_str.replace('℃', '') # 移除'℃'
temp_parts = temp_range_clean.split('/') # 分割字符串
high_temp = int(temp_parts[0].strip()) # 使用strip()去除可能的空白字符
low_temp = int(temp_parts[1].strip())
try:
day_wind_speed = int(row['Wind'].split('/')[0].split()[-1].split('-')[0])
except ValueError:
day_wind_speed = 0
try:
night_wind_speed = int(row['Wind'].split('/')[1].split()[-1].split('-')[0])
except ValueError:
night_wind_speed = 0
return high_temp, low_temp, day_wind_speed, night_wind_speed
df[['High Temp', 'Low Temp', 'Day Wind Speed', 'Night Wind Speed']] = df.apply(extract_temp_and_wind, axis=1, result_type='expand')
# 描述性分析
print(df.describe())
# 气温趋势分析
# 白天最高气温趋势分析
plt.figure(figsize=(14, 5))
plt.rcParams['font.sans-serif'] = ['SimHei'] # 指定默认字体为SimHei(黑体)
plt.rcParams['axes.unicode_minus'] = False # 解决保存图像时负号'-'显示为方块的问题
plt.plot(df.index, df['High Temp'], marker='o', linestyle='-', color='r', label='日最高气温')
plt.title('日最高气温趋势分析')
plt.xlabel('日期')
plt.ylabel('最高气温 (℃)')
plt.legend()
plt.grid(True)
plt.show()
# 最低气温趋势分析
plt.figure(figsize=(14, 5))
plt.plot(df.index, df['Low Temp'], marker='o', linestyle='-', color='r', label='最低气温')
plt.title('最低气温趋势分析')
plt.xlabel('日期')
plt.ylabel('最低气温 (℃)')
plt.legend()
plt.grid(True)
plt.show()
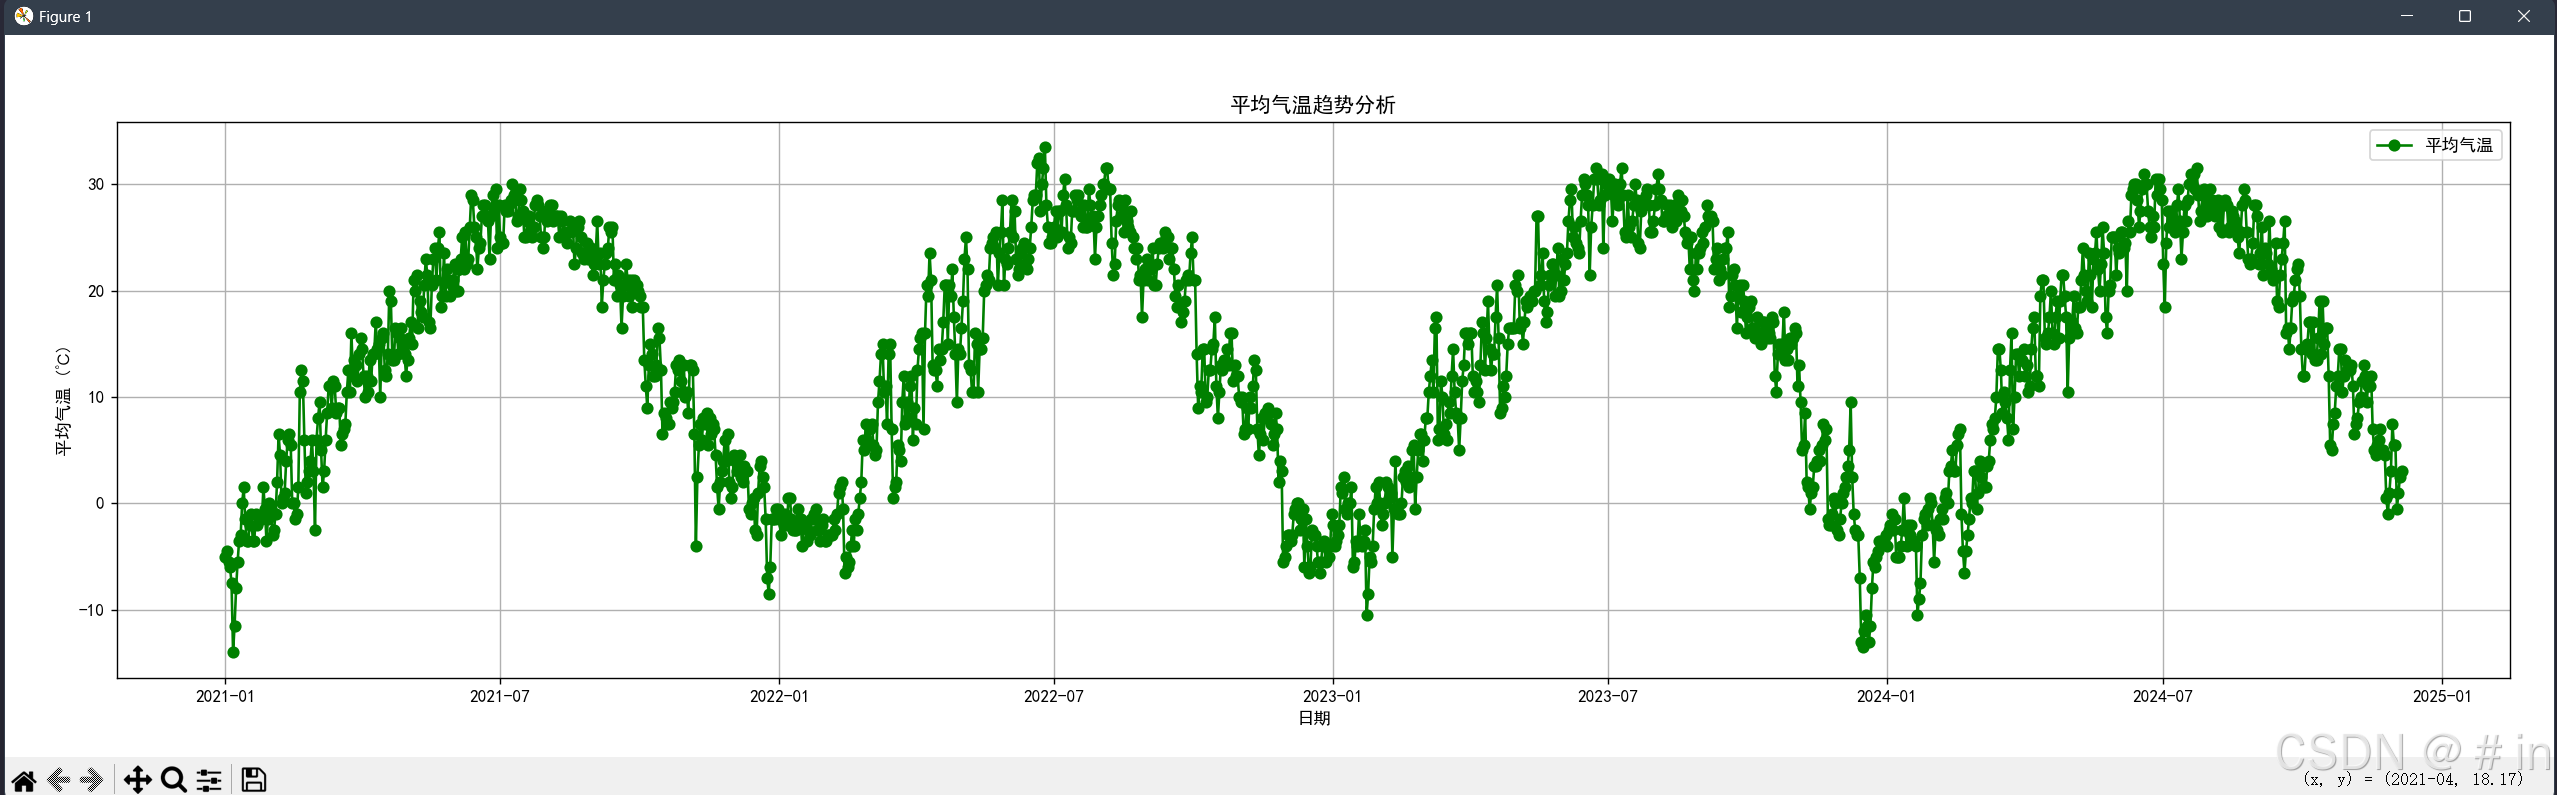
# 平均气温趋势分析
df['Avg Temp'] = (df['High Temp'] + df['Low Temp']) / 2
plt.figure(figsize=(14, 5))
plt.plot(df.index, df['Avg Temp'], marker='o', linestyle='-', color='g', label='平均气温')
plt.title('平均气温趋势分析')
plt.xlabel('日期')
plt.ylabel('平均气温 (℃)')
plt.legend()
plt.grid(True)
plt.show()
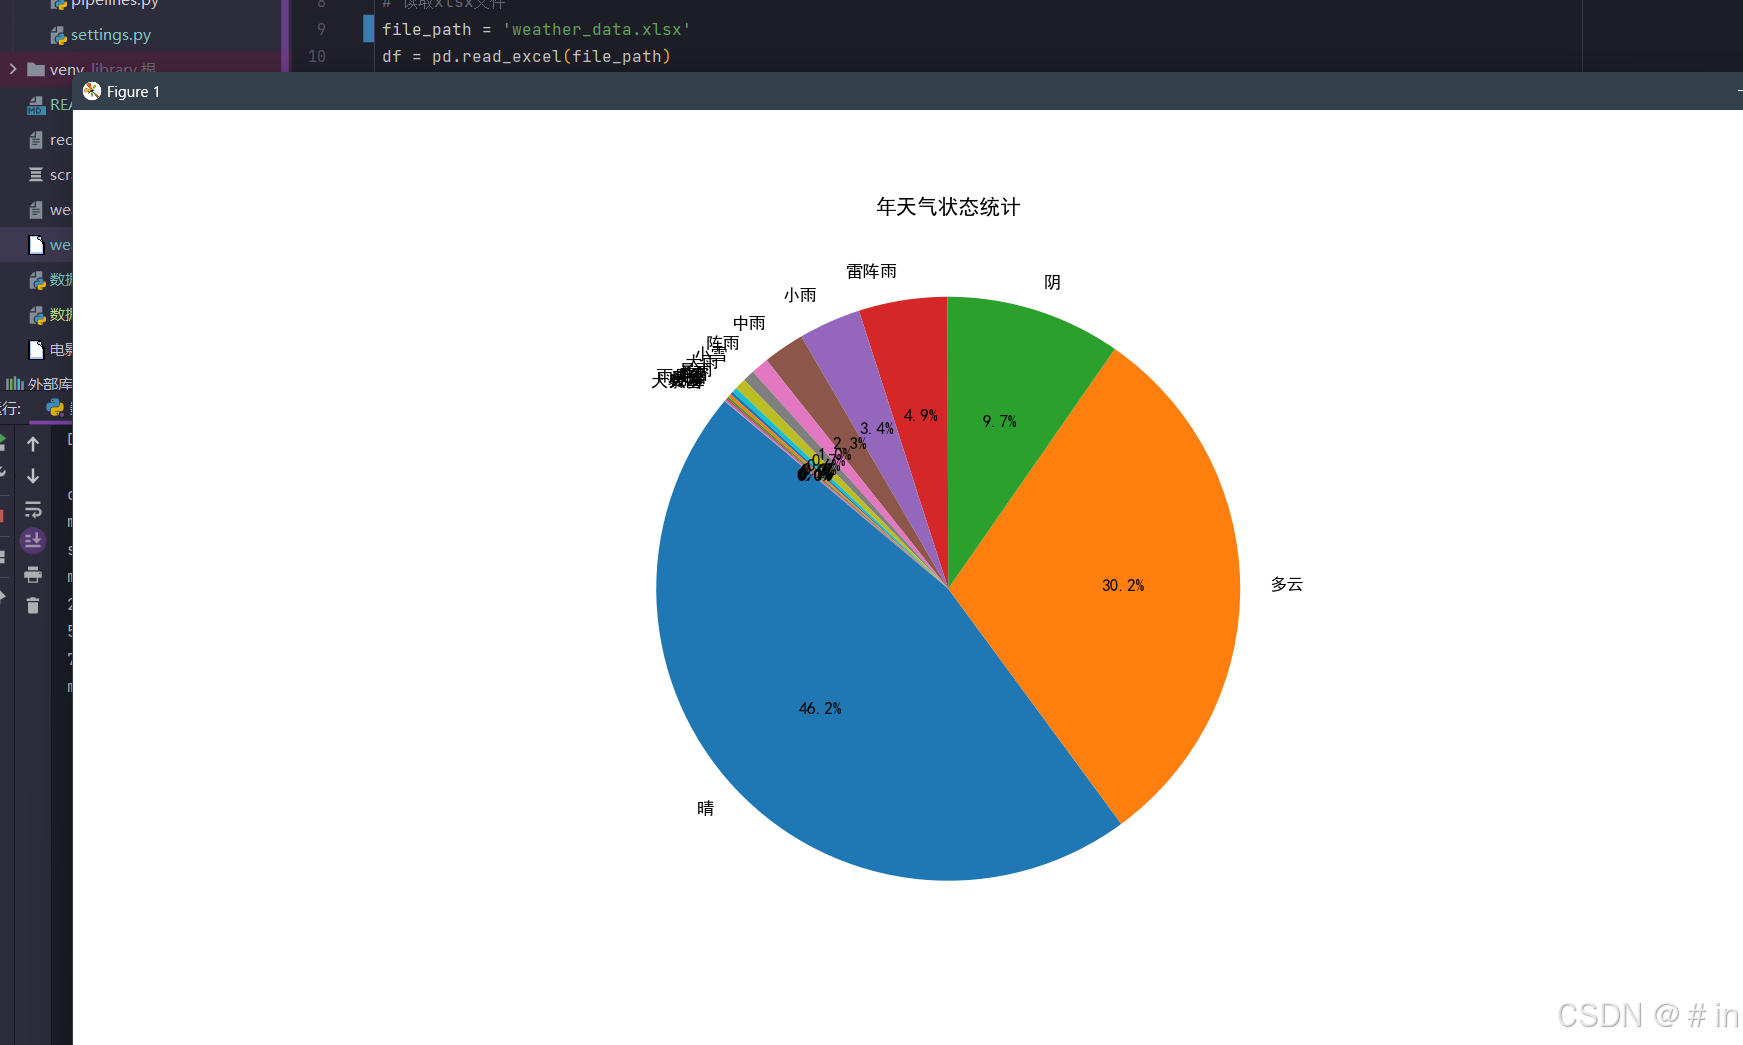
# 年天气种类统计分析
weather_counts = df['Weather'].str.split('/').explode().value_counts()
plt.figure(figsize=(10, 7))
plt.pie(weather_counts, labels=weather_counts.index, autopct='%1.1f%%', startangle=140)
plt.title('年天气状态统计')
plt.show()
# 年白天风力等级折线图
plt.figure(figsize=(14, 5))
plt.plot(df.index, df['Day Wind Speed'], marker='o', linestyle='-', color='purple', label='白天风力等级')
plt.title('年白天风力等级趋势分析')
plt.xlabel('日期')
plt.ylabel('风力等级')
plt.legend()
plt.grid(True)
plt.show()
# 月份与发生3级以上风的关联性分析
windy_days = df[(df['Day Wind Speed'] > 3) | (df['Night Wind Speed'] > 3)]
windy_months = windy_days.resample('ME').size()
print(f"\n发生3级以上风的月份及天数:\n{windy_months}")
# 保定的旅游季节推荐
# 假设适合旅游的条件:白天晴或多云,气温10-25℃,风力小于3级
tourist_days = df[(df['Weather'].str.contains('晴')) &
(df['High Temp'].between(10, 25)) &
(df['Day Wind Speed'] < 3) &
(df['Night Wind Speed'] < 3)]
tourist_months = tourist_days.resample('ME').size()
print(f"\n适合旅游的月份及天数:\n{tourist_months}")
recommended_season = tourist_months.idxmax().month # 推荐旅游季节(月份)
print(f"\n推荐旅游季节(月份): {recommended_season}") # 注意:这里仅根据月份判断,实际应考虑气候特点
most_common_day_wind_direction = df['Wind'].str.split('/').str[0].str.split().str[0].mode()[0]
print(f"\n白天出现次数最多的风向: {most_common_day_wind_direction}")
# 打印气温统计
print("\n气温统计:")
print("最高气温:", df['High Temp'].max())
print("最低气温:", df['Low Temp'].min())
print("平均气温(高温):", df['High Temp'].mean())
print("平均气温(低温):", df['Low Temp'].mean())
# 打印风力统计
print("\n风力统计:")
print("最大白天风速:", df['Day Wind Speed'].max())
print("最小夜间风速:", df['Night Wind Speed'].min())
print("平均白天风速:", df['Day Wind Speed'].mean())
print("平均夜间风速:", df['Night Wind Speed'].mean())
# 打印天气统计
print("\n天气统计:")
weather_types_str = ', '.join(weather_counts.index)
print("天气类型:", weather_types_str)
print("\n每种天气的数量:")
print(df['Weather'].str.split('/').explode().value_counts())
大部分代码是ai写的,经过我手动debug,现在应该可以完美运行,


 2355
2355

 被折叠的 条评论
为什么被折叠?
被折叠的 条评论
为什么被折叠?
 到【灌水乐园】发言


