


 本文详细介绍如何在Yii2框架中集成ECharts图表库,并通过一个具体案例展示数据的动态加载与图表渲染的过程。
第一步 下载第三方包
使用compose下载 "bower-asset/echarts": "2.2.1";
以及php插件composer require "hisune/echarts-php"
第二步 创建asset bunnle类。
①
②
namespace app\assets;

use yii\web\AssetBundle;

class EchartsAsset extends AssetBundle
{
    public $sourcePath = '@bower/echarts/dist';
    public $js = [
		'echarts.js',
    ];
}
第三步 控制器传递数据
//学校经费使用情况
$fees = Fee::find()->asArray()->all();
$typename = ArrayHelper::getColumn($fees,'name');
$typeamount = ArrayHelper::getColumn($fees,'amount');
$typeusedamount = ArrayHelper::getColumn($fees,'userAmount');
return $this->render('index', [
                'typename' => $typename,
                'typeamount' => $typeamount,
                'typeusedamount' => $typeusedamount
            ]);
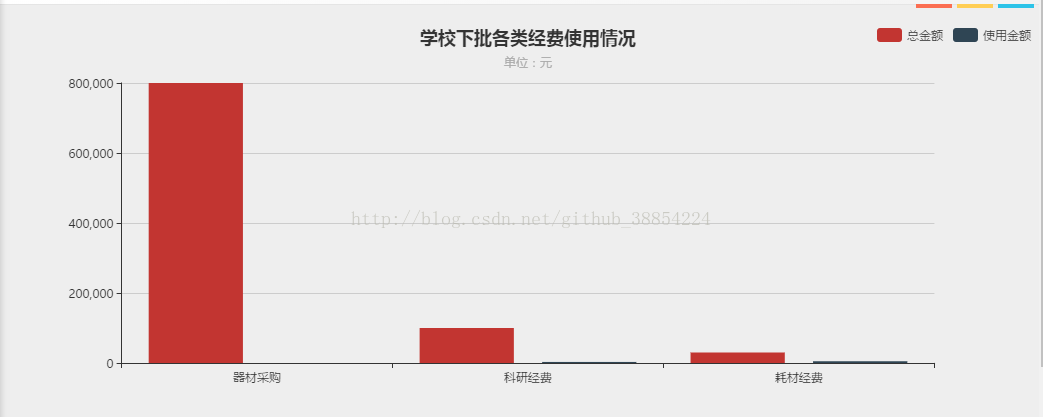
第四步 view视图渲染
<?php
use Hisune\EchartsPHP\ECharts;
?>
<div id="chart1">
<?php
    $chart = new ECharts();
    $chart->title->text = '学校下批各类经费使用情况';
    $chart->title->left= 'center';
    $chart->tooltip->show = true;
    $chart->legend->data[] = '总金额';
    $chart->legend->data[] = '使用金额';
    $chart->legend->left= 'right';
    $chart->xAxis[] = array(
        'type' => 'category',
        'data' => $typename
    );
    $chart->yAxis[] = array(
        'type' => 'value'
    );
    $chart->series[] = array(
        'name' => '总金额',
        'type' => 'bar',
        'data' => $typeamount

    );
    $chart->series[] = array(
        'name' => '使用金额',
        'type' => 'bar',
        'data' => $typeusedamount

    );
    echo $chart->render('simple-custom-1');

?>
</div>


 1336
1336

 被折叠的 条评论
为什么被折叠?
被折叠的 条评论
为什么被折叠?
 到【灌水乐园】发言


